
Last updated: August 20, 2025 • Reading time: ~5 min (Block 1)
Quick summary of this article
Learn how to use a stock screener to uncover high‑quality setups fast. In this block: why screeners are a game‑changer, and Strategy #1: Volume filters for spotting market movers before the crowd. We’ll add expert insights, a real‑life style case study, and a pros/cons snapshot.
- Who it’s for: day traders, swing traders, and long-term investors.
- Tools: any reputable screener (Finviz, TradingView, Yahoo Finance, etc.).
Why Stock Screeners Are a Game‑Changer
A stock screener is your sorting hat for the markets—instantly filtering thousands of tickers down to a focused, tradable list. Instead of sifting through noise, you search with intent: liquidity, valuation, growth, dividends, technical timing, and more.
Screeners slash research time, boost consistency, and help you stick to rules. If you’re new to markets, start with the basics of fundamentals of stock market investing, then layer screening to act faster and smarter.
Most traders fail not because opportunities don’t exist—but because they chase everything. Use targeted filters to cut the noise and focus on quality (see: cut down on the noise of the news).
“The market rewards clarity and discipline. Screeners give you both.”
When you’re ready to act, narrow your results to a short watchlist and compare with your plan or daily ideas (see daily stock picks).
Strategy 1: Filter by Volume to Spot Market Movers
Volume is the heartbeat of price. Elevated trading activity often precedes—or confirms—big moves. Start with a minimum average volume filter (e.g., ≥ 1M shares/day for large caps, ≥ 300k for small/mid caps) and look for unusual volume spikes (2×–5× the 30‑day average). For a deeper primer, see how a stock’s volume can affect its price.
Quick Setup (Any Screener)
- Set Liquidity: Average volume ≥ your minimum (e.g., 1M).
- Add Unusual Volume: Today’s volume ≥ 2× 30‑day average.
- Price Floors: Filter out illiquid penny names unless that’s your strategy.
- Optional: Add a price range (e.g., $5–$150) to match your risk profile.
- Sort: By highest relative volume or dollar volume to surface leaders fast.
Case Study: The Early Pulse
A mid‑cap tech stock opens with 3× its 30‑day average volume after pre‑market news. Price pulls back to the 20‑EMA on the 5‑min chart, holds, then trends higher with rising volume on upswings and lighter volume on pullbacks. By the close, it’s up +6.2%. The signal wasn’t the headline—it was the participation confirming demand.
Using a volume screen put this ticker on the watchlist before the move matured, allowing a structured entry with defined risk.
Expert Opinion (Buy‑side trader): “When relative volume is at least 2× and spreads are tight, I scale in on first constructive pullbacks. If the second leg up prints on higher volume, I let the winner run.”
| ✅ Pros | ❌ Cons |
|---|---|
|
✓ Confirms interest & liquidity ✓ Helps validate breakouts & trends |
✗ Spikes can be news‑driven whipsaws ✗ Requires context from price structure |
Keep learning with: best day trading books, trading courses for beginners, and our daily stock picks.
Best Practices
- Relative volume (RVOL) > 2 is a strong first pass; confirm with trend structure.
- Check spreads and slippage before sizing up.
- Pair volume with catalysts (earnings, guidance, sector news) for durability.
- Journal your screen: top 5 tickers, plan, result—iterate weekly.
Further Reading (Cards)
Key Takeaways (Block 1)
- Use a stock screener to create a focused, rules‑based watchlist.
- Volume filters (RVOL, average volume) surface liquid, high‑interest names.
- Confirm volume signals with price structure and clear risk management.
Strategy 2: Use P/E Ratios to Find Value Stocks
The Price‑to‑Earnings (P/E) ratio is a fast way to compare what investors are paying for each dollar of earnings. In a stock screener, start by filtering for reasonable P/E ranges within an industry—then layer on quality signals (earnings growth, margins, dividend safety) for a truer picture of value.
If you’re still building your foundation, review the basics in what are stocks and understanding the real value of a stock. For sector context and macro sensitivity (e.g., rate cycles that compress/expand multiples), see bank stocks surge after a Fed rate cut.

Quick P/E Screen Setup (Any Screener)
- Choose an industry/sector first (P/E is comparative; software ≠ utilities).
- Set a P/E band (e.g., 8–20 for many value hunts; adjust by sector norms).
- Exclude extreme outliers (negative EPS or P/E > 100 unless growth is exceptional).
- Add quality filters: EPS growth (1Y & 3Y), gross/operating margins, debt-to-equity.
- Sort by P/E ascending, then manually review business quality and catalysts.
Expert Opinion (Equity Analyst): “A ‘cheap’ P/E without durable earnings is a value trap. I screen for below‑median P/E and above‑median margin stability within the peer group. If free cash flow tracks EPS, odds of a rebound multiple improve.”
Case Study: Multiples Mean‑Revert in Rate‑Sensitive Names
During a rate‑cut narrative, a regional bank basket traded at a P/E ≈ 8–9 versus a historical sector median near 12–13. A screen flagged banks with positive EPS revisions and Tier 1 capital ratios above peers. Over 8–12 weeks, as credit fears eased, multiples expanded toward the median, delivering double‑digit returns. See: bank stocks surge after Fed cuts.
| ✅ Pros | ❌ Cons |
|---|---|
|
✓ Fast relative‑value snapshot within sectors ✓ Helps spot multiple expansion candidates |
✗ Can mask low‑quality earnings or one‑offs ✗ Cross‑sector comparisons are misleading |
Best Practices for P/E Screens
- Compare within the same industry; supplement with EV/EBIT or EV/FCF for capital‑intensive names.
- Add earnings quality checks: accruals, cash conversion, consistent margins.
- Look for catalysts (cost cuts, unit growth, pricing power) before betting on multiple re‑rating.
- Cross‑reference with fundamentals to avoid traps.
Related reads: forms of stocks, how to identify bad stock news, daily stock picks.
Authority Resources
Key Takeaways (Block 2)
- P/E works best inside peer groups—don’t compare software to utilities.
- Cheap ≠ good: verify earnings quality, margins, and cash flow.
- Hunt for catalysts that justify multiple expansion (or protect from compression).
Strategy 3: Track Earnings Growth for Long‑Term Winners
Durable earnings growth is one of the most reliable engines of multi‑year stock advances. When you use a stock screener, filter for companies with rising EPS (1Y, 3Y, and projected next‑12‑months), then confirm with stable or improving margins and free cash flow. Price tends to follow the trajectory of profits.
If you’re still aligning your fundamentals, start with fundamentals of stock market investing and review how smart long‑term investing pairs quality with patience. For idea flow, browse daily stock picks or our take on Tesla stock predictions to see how earnings revisions can shift sentiment.
Quick Earnings‑Growth Screen (Any Screener)
- EPS Growth Filters: 1Y EPS growth ≥ 15% and 3Y CAGR ≥ 10%.
- Forward Growth: Next‑12‑month EPS estimate ≥ 10% above trailing twelve months.
- Margins: Operating margin flat‑to‑up year over year; gross margin not deteriorating.
- Cash Conversion: Positive free cash flow (FCF) and FCF trending upward.
- Quality Guardrails: Debt‑to‑equity below industry median (or improving trend).
- Sort: By highest EPS revision momentum (upward analyst estimate changes).
Expert Opinion (Growth PM): “I don’t chase headlines—I chase revisions. When estimates rise for multiple quarters and margins hold, I let the winner compound. If revisions roll over, I reduce fast.”
Case Study: From Beats to Re‑ratings
A consumer software firm posted four consecutive EPS beats with accelerating net retention. The screener flagged 3Y EPS CAGR > 20% and two quarters of upward estimate revisions. As confidence built, the valuation re‑rated from 25× to 34× forward earnings over six months. The key wasn’t just growth—it was credible, repeatable growth confirmed by margins and cash flow.
| ✅ Pros | ❌ Cons |
|---|---|
|
✓ Aligns with long‑term compounding winners ✓ Upward revisions often precede price strength |
✗ High growth can be priced‑in (multiple risk) ✗ Growth without cash flow can mask fragility |
Best Practices for Earnings‑Growth Screens
- Favor consistent growers over one‑off spikes; look for 3+ consecutive beats/raises.
- Track operating leverage: revenue up faster than operating expenses.
- Confirm cash discipline: capex needs vs. FCF, share‑based comp, and dilution.
- Use a risk checklist from how to identify bad stock news before entering.
- Level up skills with trading courses for beginners.
More growth angles: crypto trend pieces, Ethereum outlook, and AI’s impact on markets.
Authority Resources
Key Takeaways (Block 3)
- EPS growth + margin stability is a powerful combo for sustained trends.
- Estimate revisions are an early signal; track them alongside price.
- Cash flow matters: profits should translate into liquidity over time.
Strategy 4: Screen for Dividend‑Paying Stocks
Dividends can transform a good portfolio into a compounding machine. In your stock screener, filter for forward dividend yield, payout ratio, and 5‑year dividend growth to find names that deliver cash and stay durable through cycles. Pair that with sector context (utilities, staples, pipelines, REITs) and you’ll quickly build an income watchlist that doesn’t sacrifice quality.
If you’re getting started with income strategies, read our guide on leveraging dividends for passive income, review the forms of stocks, and decide where dividend stocks fit within your plan: Roth IRA or regular brokerage account.

Quick Dividend Screen (Any Screener)
- Yield Floor: e.g., ≥ 2.0% (adjust by rate environment and sector).
- Payout Ratio Guardrail: ≤ 60% for most sectors (REITs/MLPs differ; use sector norms).
- Dividend Growth: 5‑yr CAGR ≥ 5% and no cuts over the last 5–10 years.
- Balance Sheet: Net debt/EBITDA below peers; interest coverage healthy.
- Earnings Stability: Positive free cash flow and manageable cyclicality.
- Sort: By growth‑adjusted yield (yield × 5‑yr growth) or by dividend safety score.
Expert Insight (Dividend PM): “I avoid ‘yield traps.’ If payout ratio rises while earnings flatten, I down‑weight quickly. The best dividend names show steady FCF, modest leverage, and consistent growth.”
Case Study: Income Without the Trap
A regulated utility screened with 3.4% yield, payout ratio ~55%, and 10‑yr dividend CAGR ≈ 6%. While a peer offered a 6% yield, it carried higher leverage and flat cash flow. Twelve months later, the peer cut its dividend; the quality utility maintained and raised. The screen guardrails—payout discipline and growth consistency—avoided a permanent loss of income.
| ✅ Pros | ❌ Cons |
|---|---|
|
✓ Steady cash returns enhance total return ✓ Lower volatility and behavior benefits |
✗ Yield traps (unsustainable payouts) risk cuts ✗ Sometimes slower capital appreciation |
Best Practices for Dividend Screens
- Favor growth + safety: moderate yield with rising EPS/FCF beats high yield with decay.
- Use sector‑specific metrics (FFO/AFFO for REITs; distributable cash flow for pipelines).
- Reinvest dividends (DRIP) during accumulation; switch to cash later for income.
- Map income goals inside a tax wrapper: Roth vs brokerage.
Keep building your plan with fundamentals, our daily stock picks, and how to value stocks.
Authority Resources
Key Takeaways (Block 4)
- Income without traps: balance yield with payout safety and growth.
- Quality first: stable cash flows and manageable leverage protect dividends.
- Use sector norms when judging payout ratios and coverage metrics.
Strategy 5: Use Technical Indicators to Time Entry
Fundamentals help you pick the business; technical indicators help you pick the moment. After your stock screener narrows symbols, layer timing tools—RSI, MACD, and moving averages—to enter when probability and risk look best.
If momentum is your game, start with our guide to the best indicator for swing trading, then explore actionable swing trading setups and techniques. For structure and discipline, see day trading strategies (PDF) and work with a day trading mentor.
A Simple, Repeatable Timing Framework
- Trend Filter: 20‑EMA above 50‑SMA (uptrend) or below (downtrend). Trade with the dominant slope.
- Momentum Check: RSI 40–60 is a “decision zone”; look for a bounce off 40–45 in uptrends or reject 55–60 in downtrends.
- Trigger: Bullish MACD cross above signal after a pullback to the 20‑EMA, or a higher‑low with bullish engulfing candle.
- Risk Placement: Stop below the swing low or ATR(14) × 1.5; size positions to a fixed % risk per trade.
- Exit Logic: Scale at 1R–2R; trail under higher lows or a 20‑EMA close break.
Expert Insight (Swing Trader): “My best trades align three things: trend (20 above 50), momentum (RSI firm above 50), and a clean trigger (MACD recross or strong reversal candle). If all three aren’t present, I pass. Patience is an edge.”
Case Study: Pullback Entry with Momentum Confirmation
A screened mid‑cap broke out on volume, then retraced to the 20‑EMA. RSI held ~48–50 (bullish range), and MACD recrossed up as price printed a higher low. Entry on the engulfing candle, stop below the pullback low, first scale at 1.8R, trail on 20‑EMA break. The indicator stack kept risk tight and improved expectancy.
| ✅ Pros | ❌ Cons |
|---|---|
|
✓ Adds structure to entries and exits ✓ Helps avoid impulsive “chasing” |
✗ Lagging by design—signals can arrive late ✗ Over‑optimization risks curve‑fitting |
Best Practices for Indicator‑Based Timing
- Confluence > single signals: require trend + momentum + trigger.
- Backtest simply: 10–20 rules‑based trades per setup; journal outcomes.
- Risk first: ATR‑based stops and fixed % risk keep losers small.
- Automate watchlists and alerts with swing trade bot or swing trading alerts.
- Sharpen skills with beginner trading courses and mentorship.
More timing reads: swing trading methods • success stories • daily stock picks
Authority Resources
Key Takeaways (Block 5)
- Let the screener find candidates; let indicators refine timing.
- Stack confluence (trend + momentum + trigger) for higher quality entries.
- Codify risk with ATR‑based stops and pre‑planned exits.
Strategy 6: Combine Multiple Filters for Precision
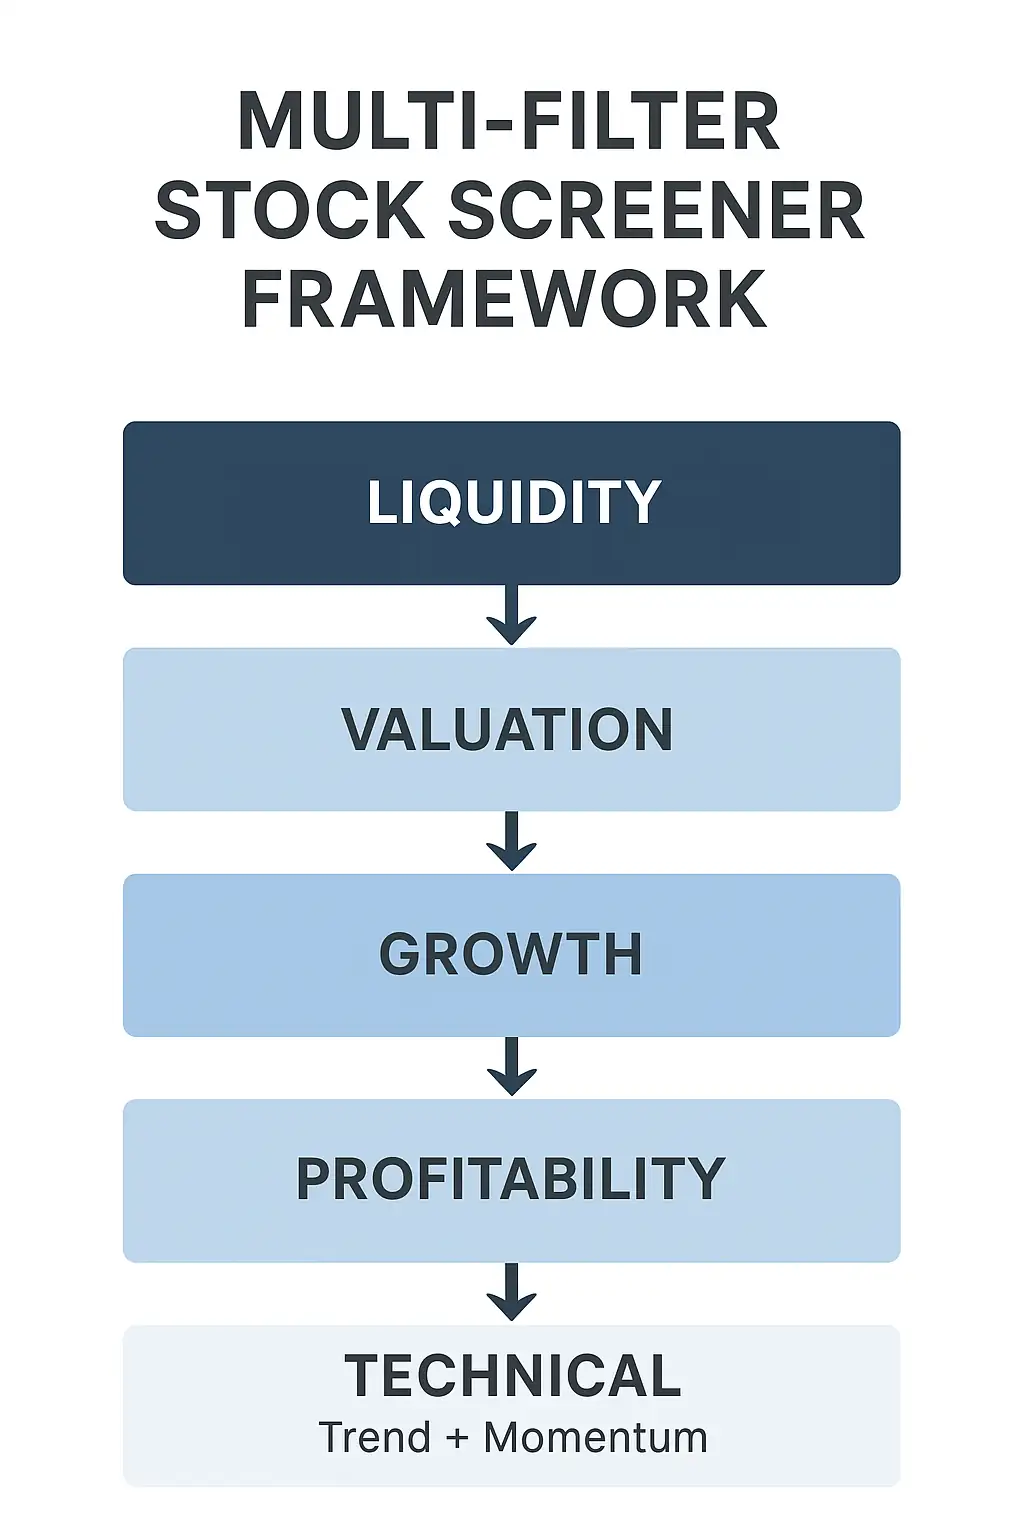
A single filter finds candidates. A stack of filters finds quality. After your stock screener narrows by liquidity, layer valuation (P/E or EV/EBIT), growth (EPS trends, revisions), profitability (margins/ROIC), and technicals (trend + momentum) to isolate high‑probability setups. This multi‑signal approach reduces noise and improves repeatability.
If you like faster names, start with liquidity rules and then apply value‑and‑growth filters—even in small caps. See: penny stocks to watch, best penny stocks to buy now, and our daily stock picks for examples of layered screening in action.
A Practical Layered Screen (Copy This)
- Liquidity: Avg. volume ≥ 1M (or dollar volume ≥ $25M/day).
- Valuation: P/E ≤ industry median (or EV/EBIT within bottom 40% of peers).
- Growth: EPS 1Y ≥ 15%, 3Y CAGR ≥ 10%, and positive analyst revisions.
- Profitability: Operating margin ≥ peer median; ROIC ≥ peer median.
- Balance Sheet: Debt-to-equity ≤ peer median or improving trend.
- Technicals: 20‑EMA ≥ 50‑SMA (uptrend), RSI ≥ 50; price above 50‑SMA.
- Sort & Review: Sort by revision momentum, then manually check catalysts and risks.
Expert Insight (Quant PM): “A single factor’s edge decays. Blending liquidity, quality, and momentum makes performance more resilient across regimes. We rebalance factor weights quarterly and cap exposure to any one style.”
Case Study: Hidden Gem via Confluence
A mid‑cap industrial cleared all layers: avg. volume 1.3M, P/E 17 vs peer 22, EPS 3Y CAGR 14%, ROIC above peer median, debt/eq falling, and in an uptrend (20 > 50). An earnings beat triggered upward revisions and a breakout on rising volume. The position trended for weeks while risk stayed defined under the 50‑SMA. The win came from confluence, not a single “magic” filter.
| ✅ Pros | ❌ Cons |
|---|---|
|
✓ Filters out low‑quality noise quickly ✓ Confluence improves durability of signals |
✗ Too many rules can over‑filter opportunities ✗ Requires maintenance as market regimes shift |
Best Practices for Multi‑Filter Screens
- Start simple, add layers until results are 20–60 tickers—then refine.
- Guard against over‑fitting: keep rules intuitive and few.
- Re‑test quarterly: if macro shifts (rates, credit), revisit valuation/growth bands.
- Pair with alerts and watchlists via day trading alerts and swing trade bot.
- Before entry, scan how to identify bad stock news to avoid avoidable landmines.
Keep sharpening process with trading courses, mentorship, and trading the same stocks.
Authority Resources
Key Takeaways (Block 6)
- Confluence beats single metrics: blend liquidity, value, growth, quality, and technicals.
- Keep it lean: too many filters can hide good ideas—aim for a focused but fertile list.
- Refresh with regime changes: recalibrate when rates, credit, or sector leadership shift.
Strategy 7: Save & Automate Screens for Efficiency
Screening once finds ideas today. Saving and automating your screens finds ideas every day—without babysitting the tape. After you design a winning stock screener, save the preset, schedule checks at fixed times, and set alerts (price, volume, breakout levels, earnings windows). This turns your process into a repeatable machine.
For a daily flow, pair automation with our curated lists: daily stock picks, top stock alerts, and the trade of the week. If you swing trade, tie alerts into swing trading alerts or a swing trade bot for watchlists and signals.
A Simple Automation Playbook
- Save Presets: Lock in your Volume, Valuation (P/E), Earnings‑Growth, Dividend, and Multi‑Filter screens.
- Schedule: Run them at the same times each session (e.g., pre‑market, lunch, power hour).
- Alerts: Create price/volume/RSI alerts for tickers graduating from screen to watchlist.
- Tiers: Tag results as A (ready), B (needs catalyst), C (monitor only).
- Copybook: For A‑setups, pre‑write entry/stop/scale rules; store in a template note for quick execution.
- Review: Weekly prune: remove chronic under‑performers; archive one‑offs; refine thresholds.
Expert Insight (Systematic Trader): “My edge isn’t prediction—it’s process. I automate screens, auto‑tag tickers by rules, and only touch names that meet pre‑defined criteria. Decisions are faster and cleaner.”
Case Study: From Chaos to Cadence
A part‑time trader kept missing breakouts and chasing noise. He saved five presets (Volume, Value, Growth, Dividend, Multi‑Filter), scheduled runs at 9:15 AM, 12:10 PM, and 3:05 PM, and set alerts for relative volume ≥ 2 or price above 50‑SMA. Over six weeks his average trade count fell 30% while expectancy rose—fewer, cleaner A‑setups sourced by automation.
| ✅ Pros | ❌ Cons |
|---|---|
|
✓ Consistent, time‑boxed workflow ✓ Fewer missed moves; less impulsive trading |
✗ Over‑automation can ignore nuance ✗ Alerts fatigue if thresholds are sloppy |
Best Practices for Alerts & Workflows
- One inbox for all alerts (platform, email, or chat) to cut context‑switching.
- Name presets clearly (e.g., “Liq+Value+Growth v3”) and version them.
- Throttle alerts: use RVOL, price levels, and time windows to avoid spam.
- Connect alerts to a trade checklist (entry, stop, target, thesis, risk).
- Feed shortlisted names into daily stock picks and top stock alerts for additional confirmation flow.
Next steps: day trading alerts • swing trade bot • trading the same stocks
Authority Resources
Key Takeaways (Block 7)
- Save presets and schedule them to run at consistent times.
- Use targeted alerts (RVOL, price levels, moving averages) to surface A‑setups.
- Review & refine weekly—automation is a process, not a one‑time task.
High-Authority External Resources
Explore these top resources to deepen your knowledge of stock screening, valuation, and technicals.
🔑 Global Key Highlights
- 7 proven strategies combine fundamentals + technicals for reliable stock picks.
- Stock screeners save time and sharpen focus—automation boosts consistency.
- Confluence matters: volume, P/E, earnings growth, dividends, and technicals stacked together yield durable results.
- Process over prediction: screen, alert, review, refine, repeat.
Frequently Asked Questions
What is the best free stock screener?
Popular free stock screeners include Yahoo Finance, TradingView, and Finviz. Each offers filters for valuation, volume, and technical indicators.
Can beginners use a stock screener effectively?
Yes—start simple with filters like average volume and P/E ratios. Add more layers (dividends, technicals) as you gain experience.
Do stock screeners guarantee profits?
No. Screeners are tools for filtering opportunities. Profits depend on execution, discipline, and risk management.
How often should I run my saved screens?
Active traders run them daily (pre-market and mid-day). Long-term investors may only need weekly or monthly checks.
🚀 Ready to Find Winning Stocks?
Put these 7 proven strategies into action today with your favorite screener. For curated lists, see our Daily Stock Picks and Top Stock Alerts.
👉 Don’t just read—apply, refine, and grow your edge!