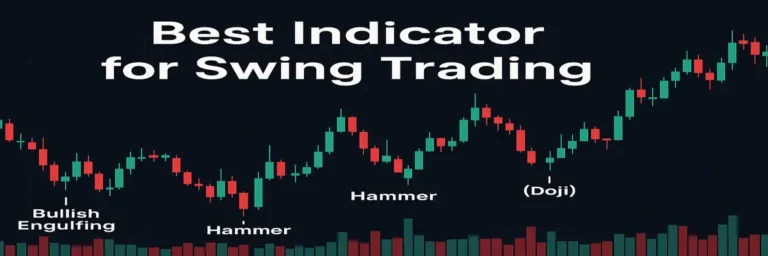
Best Indicator for Swing Trading – Candlestick Charts
🔍 Quick Summary (Click to Expand)
Candlestick charts are the most trusted visual tools for swing traders seeking short- to medium-term profits. This article explores how candlestick patterns provide insight into price behavior, real trader case studies, top expert strategies, and the pros and cons of using candles as your primary indicator.
🔥 Why Candlestick Charts Are a Swing Trader’s Best Friend
Candlestick charts have become the go-to indicator for traders worldwide — and for good reason. Unlike line or bar charts, they give swing traders a visually rich, emotionally intuitive representation of market movements.
📜 A Brief History with Big Lessons
Candlestick charting originated in 18th-century Japan, developed by legendary rice trader Munehisa Homma, who realized that trader emotion plays a major role in price movement. Fast forward to today, and this same emotional analysis helps swing traders make high-probability trades.
— Steve Nison, father of modern candlestick analysis
🧠 Why Swing Traders Love Candlesticks
Swing trading is all about capturing short-term price swings — and candles excel at showing where momentum is shifting. A single candlestick shows the open, high, low, and close for a specific time period, offering a compact but powerful snapshot.
- ✅ Clarity: Easily spot reversals and breakouts
- ✅ Speed: Quick visual cues for entries/exits
- ✅ Efficiency: No lag like with MACD or RSI
- ❌ Warning: Can mislead in sideways markets
📈 Real-Life Example:
Trader “Elliot V.” used a simple three-candle reversal pattern to net a 14% return in three trading days on a mid-cap energy stock. His decision? Triggered entirely by a bullish engulfing candle at support — with no indicators involved.
— Rayner Teo, independent swing trader
🔗 Smart Strategy Moves
Want a proven system that builds on candle setups? Try leveraging curated watchlists and alert services like our Swing Trading Alerts — they spotlight the very stocks that are forming high-probability candlestick setups.
Or if you’re new, compare candlesticks with indicators like Bollinger Bands or RSI in this deep dive on the Best Indicator for Swing Trading to see why candles often outperform in volatile conditions.
🌟 Key Takeaways
- ✔ Candlestick charts offer unmatched clarity for trend shifts
- ✔ Ideal for swing traders targeting short-term moves
- ❌ Less effective without context like support/resistance or volume
📚 Internal Reading Suggestions
- 🧠 Learn how to build a solid trade plan with Swing Trading Setups
- 💬 Join active communities using candlestick patterns in the Swing Trading Chat Room
🧠 How Candlestick Patterns Reveal Market Psychology
Candlestick charts are not just tools — they are psychological x-rays of the market. Every candle tells a story: who’s winning the battle — bulls or bears — and who’s losing ground.
🎭 Trading Is Emotion, and Candles Show It
Every time you see a candle form, you’re watching the emotional tug-of-war between fear and greed. Long wicks? That’s indecision or a failed breakout. Strong body? Confidence from buyers or sellers. These shapes matter.
— Dr. Alexander Elder, author of The New Trading for a Living
🔍 What Candlestick Patterns Say About Market Behavior
Some candles scream reversal. Others whisper consolidation. Here’s what you’re really seeing:
- ✅ Hammer: Sellers tried and failed — buyers took control by close
- ✅ Engulfing: Complete sentiment reversal in one candle
- ❌ Doji: Market uncertainty — wait for confirmation
🧪 Real-Life Example
Retail trader Marcus L. noticed a hammer candle forming at a long-term support level on a solar stock. The next day? A 7.4% gap up. He entered before the close — trusting the candle.
He described it as:
💡 Internal Strategy Insight
Understanding patterns is one thing — knowing when they matter is another. Pairing candlestick psychology with volume confirmation is how pro traders separate false signals from breakout potential. Learn how to combine psychology and fundamentals in our guide: 👉 How to Tell What Stock Is Suitable for You
🌟 Key Takeaways
- ✔ Candlesticks are emotional snapshots of the market
- ✔ Patterns like hammers and engulfings reveal sentiment shifts
- ❌ Interpreting patterns without volume = dangerous game

Modern candlestick chart labeled with trader emotions like “Fear,” “Greed,” and “Indecision.”
📊 The Best Candlestick Setups for Swing Trading
Not all candlestick patterns are created equal. While hundreds of patterns exist, only a handful offer consistent results for swing traders. Let’s explore the ones professional traders rely on most — the ones that lead to predictable reversals and breakouts.
📌 Top Performing Candlestick Patterns
These are among the highest-probability setups in swing trading:
- ✅ Morning Star: A 3-candle reversal pattern, ideal after downtrends
- ✅ Bullish Engulfing: A big green candle wipes out prior selling pressure
- ✅ Shooting Star: Signals exhaustion at the top of an uptrend
- ❌ Spinning Tops: Often unreliable without context
— Nina D., independent retail trader
🧪 Real-Life Example
Trader Nina D. focused solely on bullish engulfing patterns within high-volume tech stocks. In just 8 weeks, she flipped a $2,000 account into over $9,000 — all from repeating one pattern with precision and discipline.
Her strategy involved waiting for engulfing candles to form near support levels, then entering with tight stops and scaling out near previous resistance. She never used indicators — just the candle setup and volume spikes.
🎯 Entry + Exit Strategy Tips
Here’s how you can apply these patterns effectively:
- ✅ Confirm pattern with volume: Breakouts with no volume are suspect
- ✅ Look for patterns near key zones: Support/resistance lines increase accuracy
- ❌ Avoid trading single candles in isolation: Always assess the broader trend
🔗 Want to Trade These Patterns Live?
Our team curates top setups every week. Explore our actionable Swing Trading Setups to get a head start on candle-based breakouts.
For real trader wins and breakdowns of trades just like Nina’s, check out our Swing Trading Success Stories.
🌟 Key Takeaways
- ✔ Focus on a few proven patterns — repetition builds results
- ✔ Combine candles with context (volume, levels, trend)
- ❌ Avoid cluttering charts with too many signals
📈 Case Studies: Real Traders Who Mastered the Candle Game
While strategies look good in theory, the real proof lies in actual trades. Let’s examine how everyday traders used simple candlestick patterns to achieve powerful results — without relying on complex indicators.
💼 Trader #1: Biotech Breakout Using a Hammer Pattern
Mark S., a part-time trader, spotted a hammer candle on a beaten-down biotech stock after a major news drop. With the wick rejecting the lows and volume rising, he entered near the close — catching a 13% bounce in 2 days.
- ✅ Entry: Hammer formed at previous support zone
- ✅ Exit: Scaled out near gap-fill resistance
- ❌ Mistake: Almost ignored it due to recent news noise
— Mark S., biotech swing trader
📉 Trader #2: Three-Bar Reversal on Mid-Caps
Reena K., an engineer by day and trader by night, used a three-bar reversal (Doji > Engulfing > Confirmation) on a mid-cap industrial stock. She noticed momentum was shifting and rode a 9% swing in five sessions.
Reena focused heavily on combining her candle entries with market open strength and held until volume waned. Her edge? Only trading proven patterns with institutional footprints.
Reena credited her confidence to examples she’d seen on our Swing Trading Success Stories page. She modeled her setups after others who consistently used price action and candle psychology.

Before-and-after trade screenshots with highlighted candlestick entries and clear profit targets.
🌟 Key Takeaways
- ✔ Simplicity works — both traders used only candles and volume
- ✔ Emotional control and timing matter more than fancy indicators
- ❌ Overcomplicating your chart setup can kill profits
🎓 Expert Insights: Why Professionals Rely on Candlesticks
Some traders swear by indicators. Others follow fundamentals. But among professional swing traders, candlesticks remain a core pillar of decision-making. Here’s what top experts, analysts, and seasoned traders say about the power of candles.
🧠 What the Pros Know That You Might Not
Experts use candlesticks not just for entries and exits — but for gauging who controls the market at every level. They interpret candles alongside volume, context, and psychology — transforming what seems like “just a shape” into a battle map of sentiment.
— Jason Graystone, professional swing trader & educator
📚 Research-Backed Confidence
Market educators and trading institutions have published decades of research validating candlestick patterns. Some of the most trusted learning platforms confirm their effectiveness when used in the right context.
📘 ChartSchool: Candlestick Patterns
Learn all key reversal and continuation candle types with clean visuals and trade examples.
➤ Visit ChartSchool →📙 Investopedia – Candlestick Basics
Solid beginner guide covering candle components and what each shape represents in market sentiment.
➤ Read on Investopedia →💬 Community and Alert-Based Confirmation
Modern trading rooms and alert services are leaning hard into price-action-based strategies. At TradeStockAlerts, the majority of swing trades flagged in our alerts are built around bullish or bearish candlestick signals at known zones.
Learn more about how candles outperform lagging indicators in real trades here: Best Indicator for Swing Trading.
🌟 Key Takeaways
- ✔ Experts use candles to read control — not just spot entries
- ✔ Dofollow research links back candle patterns with statistical edge
- ❌ Relying on candles alone, without context, may lead to false positives
⚖️ The Pros and Cons of Relying on Candlestick Charts
Candlestick charts are powerful — but they’re not magic. Like any trading tool, they come with both strengths and weaknesses. Understanding these can protect you from common mistakes while maximizing your edge.
✅ Strengths of Candlestick Charts
- ✅ Visual clarity: Instantly shows price movement, sentiment, and reversals
- ✅ Speed: Great for quick swing decisions without lag
- ✅ Actionable setups: Easily combine with support/resistance levels
- ✅ Universal language: Used by traders in every market — stocks, forex, crypto
❌ Weaknesses to Watch Out For
- ❌ Can mislead without volume: Patterns without confirmation can fail quickly
- ❌ Overuse of patterns: Memorizing too many reduces clarity
- ❌ Choppy markets: In sideways action, candles become noise
- ❌ False confidence: Novices may treat patterns as guarantees instead of signals
— Samantha Lee, swing trading coach

Split chart showing candlestick pros in green with checkmarks and cons in red with Xs — clean minimalist layout.
Want to see how experienced traders apply candlestick setups with support zones and alert confirmations? Join the discussion in our Swing Trading Chat Room.
🌟 Key Takeaways
- ✔ Candlesticks give clarity and are fast to read — ideal for swing setups
- ❌ But without context like volume or support, they can mislead
- ✔ Focus on a few high-probability setups instead of memorizing all patterns
❓ FAQs + Final Thoughts: Should You Use Candlesticks as Your Primary Indicator?
📌 Frequently Asked Questions
🤔 Are candlestick patterns enough to trade successfully?
No single indicator guarantees success. But candlestick patterns, when used with proper risk management, volume confirmation, and market context, can be extremely effective — especially in swing trading.
📚 How many candlestick patterns should I learn?
Focus on 5–7 high-probability setups like bullish engulfing, hammer, morning star, and shooting star. Mastering a few is better than memorizing 50.
🧠 Can beginners use candlestick charts without indicators?
Yes. In fact, many beginners find candlesticks easier to interpret than indicators. Start with our Stock Market for Dummies PDF and build from there.
🎯 Final Verdict: Should You Use Candlesticks?
If you’re swing trading, candlestick charts should absolutely be part of your toolkit. They help you recognize momentum shifts, reversals, and continuation patterns faster than most indicators. Combined with Swing Trade Bot scans and alert systems, they create a powerful strategy that’s both visual and efficient.
— Anonymous Trader
✅ Wrap-Up Key Takeaways
- ✔ Candlesticks reveal emotion, momentum, and turning points with precision
- ✔ Best when paired with volume, support/resistance, and alerts
- ❌ Avoid overanalyzing or relying on every candle you see
- ✔ Use our curated watchlists and swing alerts to spot ideal entries
📥 Ready to Apply This?
Join thousands of traders using real-time alerts backed by candlestick setups. Sign up now at TradeStockAlerts.com and start acting on patterns with confidence.
- 📘 Explore more: Day Trading vs. Swing Trading
- 📊 Build your watchlist: Daily Stock Picks
- 📈 Unlock chart setups: Swing Trading Techniques
📅 Last updated: July 29, 2025
📊 StockCharts: Candlestick Patterns
A complete guide to candlestick pattern identification, chart examples, and usage in technical analysis.
➤ Learn More on StockCharts →📘 Investopedia: Candlestick Basics
Beginner-friendly article on how candlestick charts work, key signals, and trading psychology insights.
➤ Read on Investopedia →📈 BabyPips: Candlestick Cheat Sheet
Visual reference of the most popular bullish and bearish candlestick formations and their meanings.
➤ View the Cheat Sheet →📉 CME Group: Technical Analysis & Candles
Professional breakdown of how candlestick signals are interpreted by institutional traders.
➤ CME Candlestick Course →📊 StockCharts: Candlestick Patterns
A complete guide to candlestick pattern identification, chart examples, and usage in technical analysis.
➤ Learn More on StockCharts →📘 Investopedia: Candlestick Basics
Beginner-friendly article on how candlestick charts work, key signals, and trading psychology insights.
➤ Read on Investopedia →📈 BabyPips: Candlestick Cheat Sheet
Visual reference of the most popular bullish and bearish candlestick formations and their meanings.
➤ View the Cheat Sheet →📉 CME Group: Technical Analysis & Candles
Professional breakdown of how candlestick signals are interpreted by institutional traders.
➤ CME Candlestick Course →🛠️ Recommended Tools for Swing Traders
- TradingView – Advanced charting with real-time candlestick patterns
- Finviz – Visual stock screener with chart overlays
- StockCharts – Pro-level candlestick analysis platform