Real Value of a Stock
Why Stock Value Matters More Than Price
— Warren Buffett
One of the biggest mistakes new investors make is focusing on stock price rather than stock value. Just because a stock is priced at $15 doesn’t make it cheap — and a $300 stock doesn’t make it expensive.
True investing success comes when you understand what you’re buying: an actual business, not just a ticker symbol. Stocks represent ownership in a company’s future earnings, brand power, assets, and even its leadership.
“Understanding value isn’t optional. It’s essential for wealth building.”
— Peter Lynch, legendary fund manager
Many beginners confuse price momentum with potential. But short-term hype, Reddit threads, and financial influencers can distort what a company is actually worth.
So how do you find value? It starts with learning the difference between market sentiment and intrinsic worth. That’s where this guide comes in.
🧠 Key Takeaways:
- ✔️ Price ≠ Value: A stock’s price is just what someone is willing to pay today.
- ✔️ Stock = Ownership: You’re buying a business, not a number.
- ✔️ Value is long-term: It reflects real assets, earnings, and growth potential.
New to stock market fundamentals? Start with our breakdown on What Are Stocks?:contentReference[oaicite:0]{index=0}
Intrinsic vs. Market Value – Know the Difference
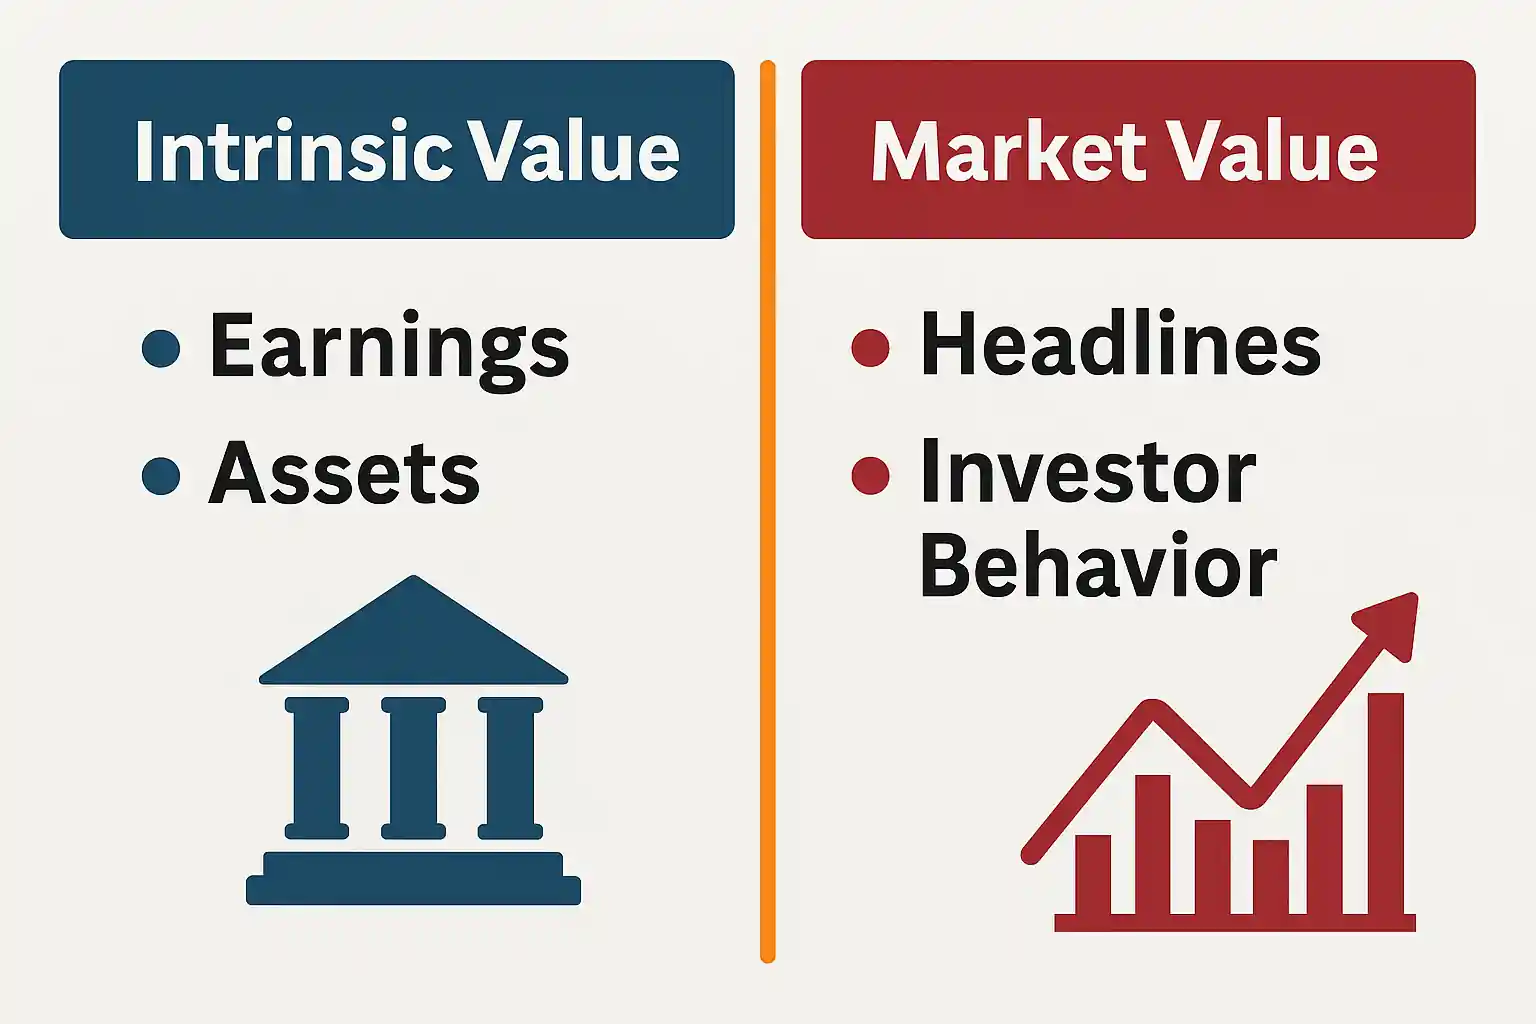
A visual split between company fundamentals (earnings, assets) and news-based market sentiment like headlines and investor behavior
What a stock is worth and what people are willing to pay for it are often two very different things. That’s the essence of intrinsic value vs. market value.
Intrinsic value is based on a company’s actual performance — its earnings, assets, future growth, and cash flow. In contrast, market value is the current stock price, which can be influenced by hype, news cycles, and trader emotions.
“The market is a voting machine in the short run, but a weighing machine in the long run.”
— Benjamin Graham, Father of Value Investing
✅ Pros & ❌ Cons:
- ✅ Intrinsic value helps long-term investors identify opportunities
- ✅ Market value reflects liquidity and real-time demand
- ❌ Market value is often driven by emotion
- ❌ Intrinsic value can be difficult to calculate accurately
If you’re relying only on price action without knowing what a company is truly worth, you might be buying into hype — or worse, a bubble.
Need a full breakdown? Read our deep dive: Understanding the Real Value of a Stock:contentReference[oaicite:0]{index=0}
Key Metrics That Drive Stock Valuation
Valuing a stock isn’t just art — it’s part science. While no single metric tells the whole story, there are several powerful tools that help uncover whether a stock is trading below, above, or near its true value.
Below are the most important metrics that seasoned investors use to evaluate the real value of a stock:
- 📊 Price-to-Earnings (P/E) Ratio – Compares stock price to company earnings. A high P/E may signal overvaluation unless justified by growth.
- 📉 PEG Ratio – The P/E ratio adjusted for expected growth. A PEG under 1 often points to an undervalued stock.
- 📘 Book Value per Share – Total assets minus liabilities divided by outstanding shares. Helps value asset-heavy businesses.
- 📈 Free Cash Flow (FCF) – Indicates a company’s ability to generate actual cash after expenses.
- 💼 Debt-to-Equity Ratio – Shows how much leverage a company uses. Too high? It could be risky.
“If a company isn’t producing free cash flow, it’s not creating shareholder value.”
— Aswath Damodaran, Professor at NYU Stern
✅ Pros & ❌ Cons of Popular Metrics:
- ✅ P/E Ratio is widely available and easy to compare
- ✅ Free Cash Flow reflects real financial health
- ❌ P/E can be misleading during market bubbles or losses
- ❌ Book Value ignores brand value and future growth
📈 Real-Life Example:
In mid-2023, NVIDIA (NVDA) traded at a P/E of 215 while UnitedHealth Group (UNH) maintained a P/E under 18 with consistent earnings growth. One was priced for perfection, the other quietly growing value. Understanding these metrics helps spot that contrast.
Want to learn how stock volume affects price movement during earnings season? Read this guide: How a Stock’s Volume Can Affect Its Price:contentReference[oaicite:0]{index=0}
Valuation Models You Can Actually Use
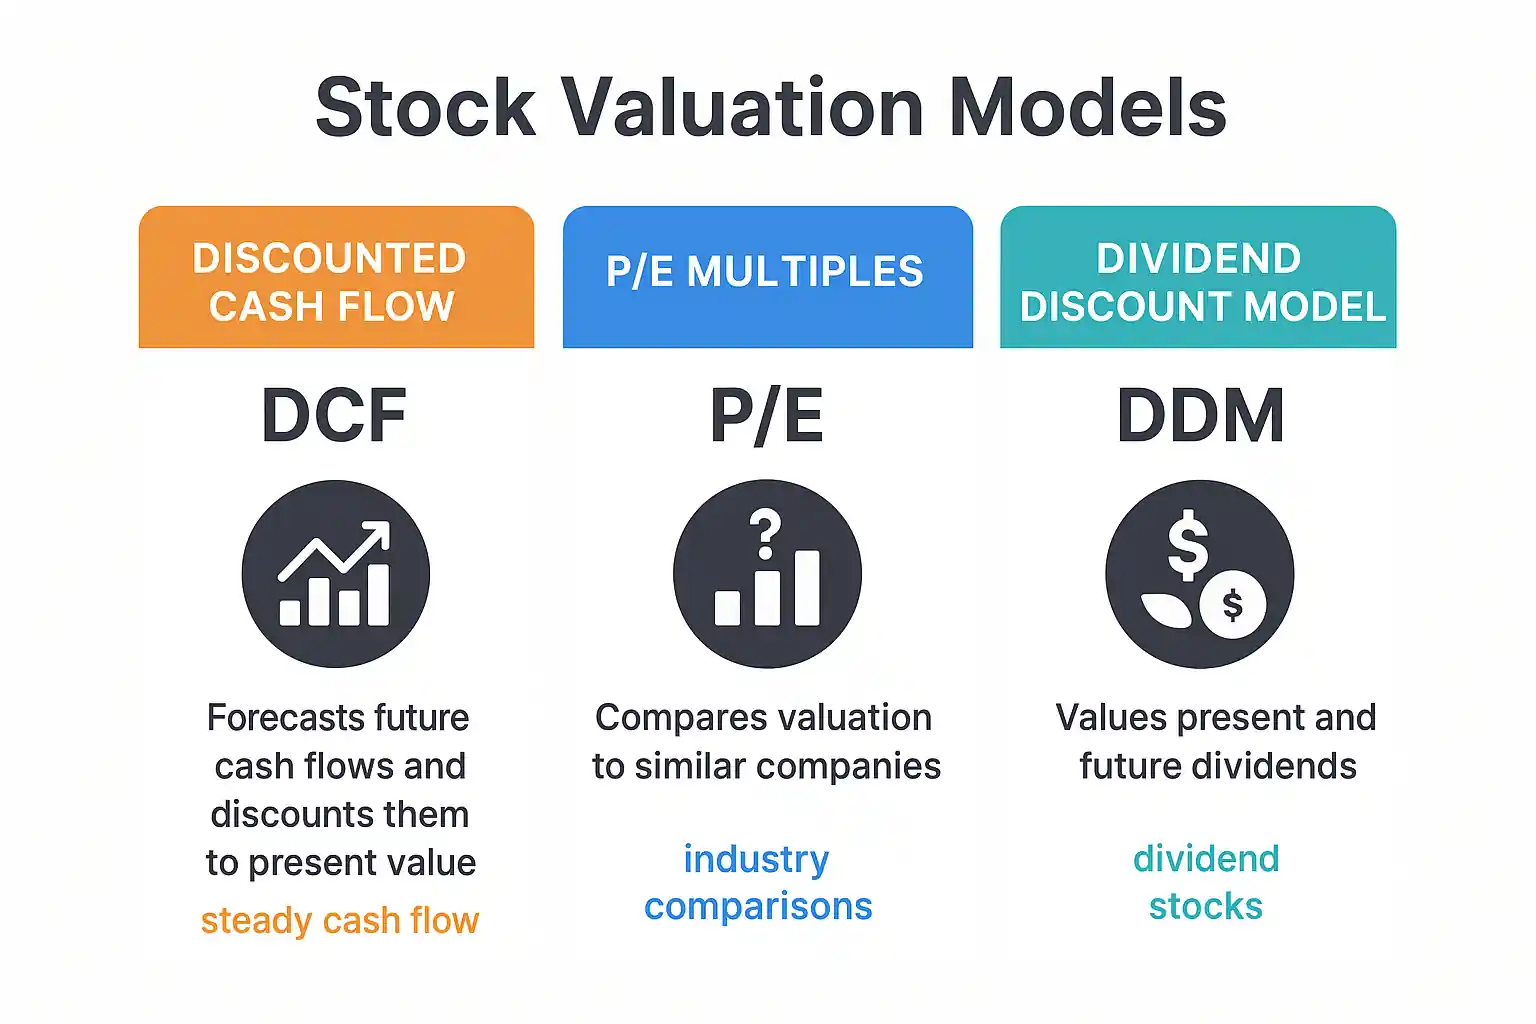
Clean infographic of three valuation models (DCF, P/E multiples, Dividend Discount Model) side by side with use cases and icons
Once you understand the metrics, you’ll want to apply a model to estimate a stock’s fair value. Fortunately, you don’t need to be a Wall Street analyst to use a few powerful models.
📊 1. Discounted Cash Flow (DCF)
This model forecasts a company’s future cash flows and discounts them to today’s value. Ideal for companies with predictable revenue streams.
📈 2. Comparable Company Analysis (Comps)
Compares valuation multiples (like P/E and EV/EBITDA) of similar companies in the same industry to gauge fair price range.
💰 3. Dividend Discount Model (DDM)
Best used for dividend-paying stocks. Values a stock based on the present value of projected future dividend payments.
“Valuation models aren’t perfect, but they help you act on logic — not emotion.”
— Barbara Smith, CFA
✅ Pros & ❌ Cons of Valuation Models:
- ✅ DCF reflects a company’s true long-term value
- ✅ Comps are quick and practical
- ❌ DCF is highly sensitive to assumptions
- ❌ DDM only works for dividend stocks
Example: A DCF applied to Tesla based on future free cash flow projections revealed a fair value 18% below market at the time — yet the stock soared on hype. Models give clarity, not predictions.
Want to understand how stock classes affect valuation? Check out Forms of Stocks: Common vs Preferred:contentReference[oaicite:0]{index=0}
Real Case Study: Undervalued vs. Overvalued Stocks
Understanding stock valuation in theory is one thing — but seeing it play out in the market is where real insight happens. Let’s examine two notable case studies that reveal how perception can wildly differ from reality.
📉 Case 1: GameStop (GME) – The Overhyped Hype
In early 2021, GameStop surged from under $20 to over $400 per share — not because of earnings or fundamentals, but due to viral Reddit campaigns and short squeezes. Its P/E ratio was irrelevant; valuation models were ignored.
📉 Valuation at the time: No earnings growth, declining revenue, outdated business model.
Yet retail traders poured in due to “FOMO,” leading to massive temporary gains — and later, equally massive losses.
“Stocks are often mispriced because people react to headlines, not fundamentals.”
— Michael Burry, Hedge Fund Manager
📈 Case 2: Meta Platforms (META) – The Oversold Giant
After a brutal selloff in 2022, Meta was trading at a forward P/E under 12, down nearly 65% from its highs. But the company still had billions in free cash flow and global platform dominance.
Value investors saw this as a deep discount opportunity — and they were right. In 2023, the stock rebounded over 100% as earnings beat expectations.
✅ Pros & ❌ Cons (Behavioral Valuation)
- ✅ Undervalued stocks offer limited downside and long-term potential
- ❌ Overvalued hype plays carry emotional volatility and massive risk
Want to know how AI-based sentiment analysis affects investor behavior? Explore our full breakdown: How AI Is Reshaping the Stock Market:contentReference[oaicite:0]{index=0}
What Affects Perceived Value in Today’s Market
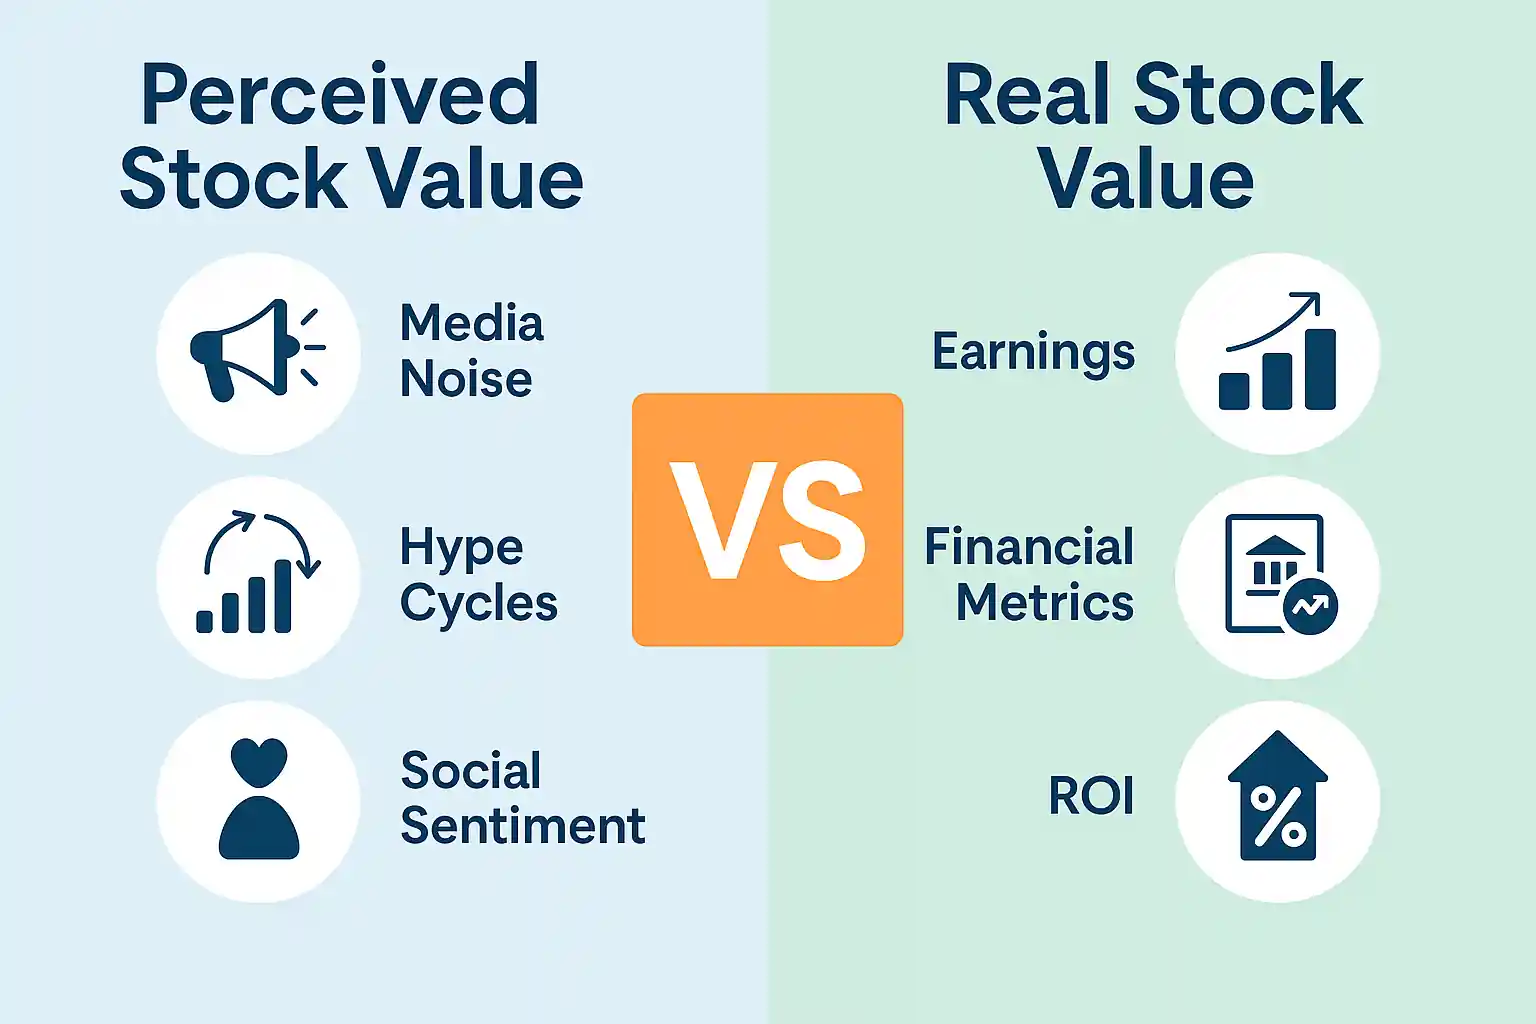
Illustrated diagram of media noise, hype cycles, and social sentiment compared to financial metrics like earnings and ROI
Why do so many investors get burned buying into hype? Because in modern markets, perception often drives price far more than fundamentals — especially short-term.
From influencer tweets and financial news headlines to Reddit threads and AI-generated trading alerts, information overload can distort a stock’s real value.
📉 Real-Life Example: AMC & Palantir
During their 2021 runs, both companies saw valuations rise despite no material earnings improvements. In AMC’s case, the company was losing money — yet its stock price tripled based on memes and momentum.
“Valuation is opinion. Price is negotiation.”
— Josh Brown, CNBC Contributor
✅ Pros & ❌ Cons (Perception-Driven Markets)
- ✅ Media exposure can bring liquidity to overlooked stocks
- ✅ Momentum plays can offer short-term gains
- ❌ Sentiment-driven trades are detached from fundamentals
- ❌ Volatility increases during market mania
One of the best ways to protect your portfolio? Learn how to spot when emotion is driving price. Our guide to market psychology helps: Bullish Bears vs. Bulls on Wall Street:contentReference[oaicite:0]{index=0}
How to Apply This to Your Portfolio Right Now
Knowing the real value of a stock is only useful if you apply it. Here’s how to use what you’ve learned in your everyday investing or trading strategy — even if you’re just starting out.
✅ Step-by-Step Portfolio Checklist
- ✔️ Screen for undervalued stocks using metrics like low PEG ratio, solid free cash flow, and modest debt
- ✔️ Apply a simple valuation model like Discounted Cash Flow (DCF) to estimate fair value
- ✔️ Compare your calculated value with the current market price
- ✔️ Use trade journals to track your decision-making over time
- ✔️ Review earnings reports quarterly to reassess your assumptions
“Buy businesses, not tickers. Think long-term.”
— Charlie Munger, Vice Chairman of Berkshire Hathaway
📘 Real Strategy: Combining Alerts + Valuation
One of the most efficient ways to apply valuation is by combining alert services with your own fair value targets. For example, a trader using Swing Trading Success Stories:contentReference[oaicite:0]{index=0} identified a breakout stock, ran a DCF, and chose to enter below fair value — resulting in a 28% return.
📌 Key Takeaways:
- 📈 Know your metrics and don’t follow hype
- 🔍 Always compare price to fair value before entering a trade
- 🧠 Let logic and numbers lead — not emotions or trends
Want daily access to curated setups and alerts that match smart valuations? Subscribe to our alert service today and start trading with purpose.
🔗 Recommended Resources for Stock Valuation
📘 Investopedia: What Is Intrinsic Value?Clear explanation and examples of how intrinsic value is calculated using cash flows and financial models. 🌞 Morningstar: Stock Valuation Basics
Beginner-friendly lessons on company analysis, earnings, and price-to-value ratios. 💡 Motley Fool: What Are Value Stocks?
Examples and definitions of undervalued stocks and how to find them. 📊 CNBC Select: Best Trading Platforms for 2025
Choose a platform that supports smart valuation and research tools. 📚 CFA Institute: Valuation Techniques Overview
In-depth breakdown of DCF, market multiples, and dividend models.
⏱️ Estimated reading time: 9 minutes