1. Introduction: Why the Stochastic Oscillator Matters
The stochastic oscillator is one of the most trusted momentum indicators in trading. Created in the 1950s by George Lane, it has stood the test of time because it helps traders see where a stock’s closing price sits relative to its price range over a chosen period (most commonly 14 days). Put simply, it measures whether a stock is trading near the high, low, or middle of its recent price action — a valuable clue for spotting potential turning points in the market.
Why does this matter to investors and day traders? Because financial markets are driven by momentum and psychology. Prices rarely move in straight lines; they ebb and flow as traders react to news, earnings, and market sentiment. The stochastic oscillator transforms this uncertainty into an actionable signal, alerting traders to overbought or oversold conditions that often precede reversals.
“Markets are never wrong – only opinions are.” – Jesse Livermore
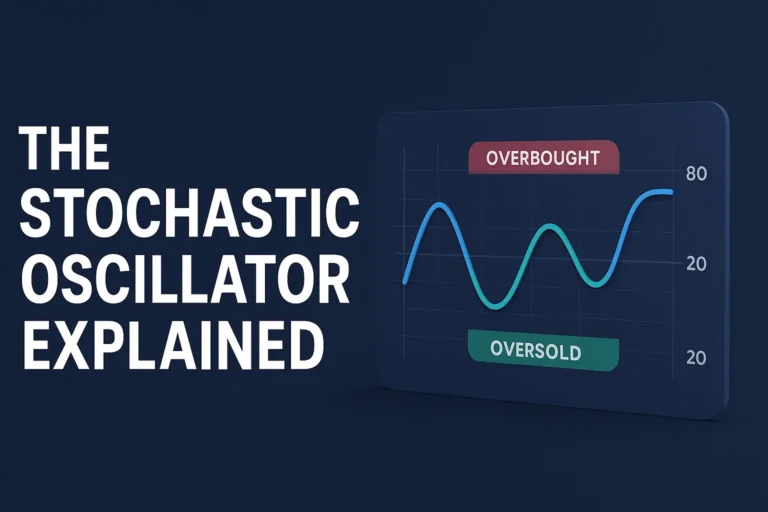
For example, when the oscillator rises above 80, the stock may be considered overbought, hinting that prices could cool off. Conversely, readings below 20 suggest oversold conditions, meaning the stock may be undervalued in the short term. Traders who understand these signals can make smarter entry and exit decisions, reducing guesswork and improving profitability.
It’s also worth noting that this tool is not limited to stocks. Many traders apply the stochastic oscillator to cryptocurrencies, ETFs, forex, and even commodities like gold. Its versatility makes it one of the few indicators that remains relevant across asset classes and timeframes.
While it may sound technical, the stochastic oscillator is built on a simple idea: momentum precedes price. By comparing the closing price to its recent range, it reveals whether buyers or sellers are in control. This helps answer a fundamental question every trader faces: Is this a good time to buy, sell, or wait?
Understanding this indicator can give traders an advantage in today’s fast-moving markets. For those new to technical analysis, it’s a powerful starting point. For seasoned traders, it adds depth to existing strategies and provides confirmation for signals from other tools like RSI or moving averages.
If you’re still learning the basics, be sure to read our guide on Fundamentals of Stock Market Investing, which lays the groundwork for using tools like the stochastic oscillator effectively.
📌 Key Takeaway
The stochastic oscillator is not about predicting the future. Instead, it highlights probabilities and shows where momentum may be shifting. This makes it one of the most proven tools for timing trades and improving decision-making.
2. How the Stochastic Oscillator Works
To truly benefit from the stochastic oscillator, it’s important to understand how it’s calculated and why traders trust it. At its core, the oscillator compares the closing price of a stock to its recent trading range over a set number of periods — usually 14 days. This comparison produces a percentage value between 0 and 100 that signals whether the stock is moving toward being overbought or oversold.
The formula has two key components:
- %K line – the main line showing where the current price sits within the recent range.
- %D line – a moving average of the %K line, which smooths out volatility and provides clearer signals.
When these two lines cross, traders often view it as a potential buy or sell signal. For example, if the %K line crosses above the %D line while both are below 20, it may indicate that the stock is oversold and due for a rebound. Conversely, a cross below the %D line near the 80 level suggests a potential pullback.
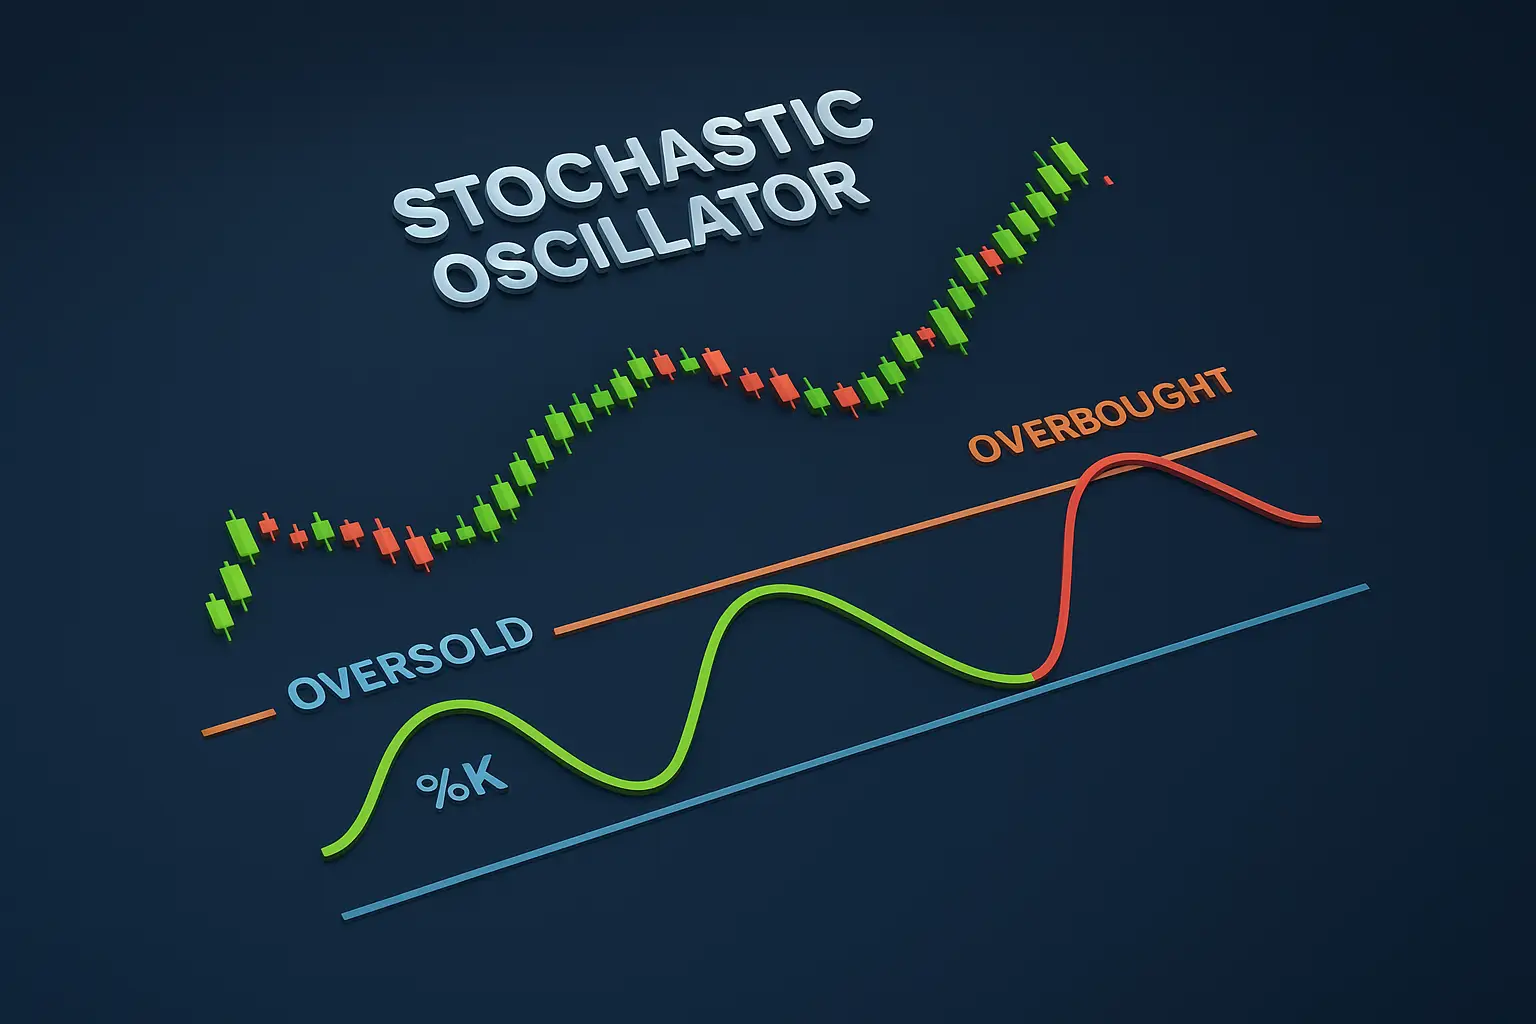
A sample chart showing %K and %D crossover signals in the stochastic oscillator.
Overbought vs. Oversold: Generally, readings above 80 imply overbought conditions, while readings below 20 suggest oversold levels. However, these thresholds are not fixed rules. In strong trending markets, a stock can remain overbought or oversold for long periods. That’s why traders combine this tool with others, like day trading alerts, to confirm opportunities.
“Momentum is the great deceiver — it carries prices far beyond what logic might suggest.” – Anonymous Trader
Another way to use the stochastic oscillator is by comparing it to moving averages. While moving averages show the general direction of price, they lag behind actual price action. The stochastic oscillator, on the other hand, gives a faster momentum signal that helps traders anticipate potential turning points before moving averages catch up.
For more detailed explanations, you can explore the Investopedia guide to stochastic oscillators, which provides formulas and examples used by professional traders.
📌 Key Takeaway
The stochastic oscillator works by comparing closing prices to recent highs and lows. By focusing on momentum shifts, it helps traders anticipate reversals and identify optimal buy or sell points earlier than lagging indicators like moving averages.
3. Core Trading Strategies with the Stochastic Oscillator
The stochastic oscillator shines when you turn its momentum signals into repeatable rules. Below are practical, battle-tested ways to translate %K and %D readings into objective entries, exits, and risk controls you can use across intraday, swing, and position trading.
A) %K / %D Crossovers at Extremes
Classic play: look for a bullish crossover when %K crosses above %D below 20 (oversold). For shorts, a bearish crossover when %K crosses below %D above 80 (overbought). Add a price-action filter: wait for the first higher high (long) or lower low (short) to confirm momentum is shifting.
- Entry: %K crosses %D at an extreme + price confirms with a break of the prior minor swing.
- Stop: Below/above the most recent swing low/high.
- Exit: Return to the mid-zone (~50) or opposite signal.
Upgrade it: Pair crossovers with a trend filter. For example, trade only long crossovers that occur above the 200‑day MA, and only short crossovers that occur below it.
B) %K Divergence vs. Price
When price makes a lower low but %K makes a higher low (bullish divergence), momentum is improving beneath the surface. Bearish divergence is the opposite. Use divergences near the 20/80 bands for higher-quality turns.
Pro tip: Divergences get stronger when they align with key levels (prior support/resistance, VWAP, or daily pivot points). Confirm with a strong candle close back inside the prior range.
C) “Stochastic + Structure” Swing Strategy
For swing traders, combine the oscillator with well-defined structure—trend channels, pullbacks to 20/50 EMAs, or horizontal bases. Enter when the stochastic exits oversold (for uptrends) right as price retests the structure level.
- Ideal zone: Uptrend, shallow pullback to 20–50 EMA, oscillator recovers from below 20.
- Targeting: Prior swing high or channel top; trail below higher lows to stay in winners.
See complementary tactics in our overview of swing trading setups and momentum-friendly swing trading techniques.
D) Multi‑Timeframe Confirmation
Anchor your bias on the higher timeframe and time entries on the lower one. Example: if the daily stochastic moves out of oversold and the trend is up, drop to the hourly and buy the first %K > %D crossover after a pullback. This stacks probabilities.
E) Stochastic + RSI “Momentum Confluence”
Many pros won’t act on a stochastic signal unless another momentum tool agrees. If RSI leaves oversold at the same time %K crosses above %D, it’s a stronger long. If RSI shows bearish divergence while stochastic is rolling over above 80, shorts get an edge.
Mini Case: After earnings, a stock gaps up and consolidates above the 20 EMA. Daily stochastic pulls back to ~25, then %K crosses above %D as price reclaims the consolidation high. Long entry triggers; stop under the base; partials at prior high; runner trails under higher lows. Result: controlled risk, trend participation.
Want to test these patterns on live or historical charts? Use an advanced charting workspace like TradingView to replay, tag, and journal each setup. Systematic review builds confidence fast.
“The market rewards consistency, not complexity.” – Veteran Trader
📌 Key Takeaway
Rules beat hunches. The stochastic oscillator becomes powerful when paired with structure (trend, levels) and confirmation (RSI, multi-timeframe). Define exact entries, stops, and exits—then repeat with discipline.
4. Case Studies & Real-Life Examples
Theory becomes truly valuable when you see how the stochastic oscillator plays out in real markets. Below are real-life examples showing how traders applied this tool to stocks and achieved more confident entries and exits.
Case Study 1: Tesla (TSLA) Swing Trade
During a volatile quarter, Tesla stock surged after earnings but soon entered a consolidation. The daily stochastic oscillator dropped near 20, signaling oversold levels despite the stock holding above its 50-day moving average. When %K crossed above %D, traders who entered saw the stock rebound strongly, capturing a high-probability move.
This case shows how oversold conditions within an uptrend often provide some of the best risk-reward opportunities. The oscillator helped confirm timing for an entry that moving averages alone could not identify.

Tesla chart with stochastic oscillator showing oversold rebound signals.
Internal Link: For those who trade smaller cap names, check our updated Penny Stock Alerts, where momentum indicators like stochastic can be extremely valuable in timing entries and exits in thinly traded stocks.
Case Study 2: Penny Stock Reversal
In the world of penny stocks, price swings are exaggerated and timing is everything. A biotech penny stock traded in a tight range before suddenly collapsing on bad news. Within days, the stochastic oscillator dipped below 10 — deep oversold territory. Sharp-eyed traders spotted the signal and entered small speculative positions. When positive trial data emerged, the stock bounced 40% in two sessions. The stochastic indicator flagged an early risk/reward opportunity that might have otherwise gone unnoticed.
Of course, penny stocks are risky. That’s why tools like the stochastic oscillator should always be paired with strict position sizing and stop-loss discipline. Read our guide on Best Penny Stocks to Buy Now to see how we evaluate high-potential but risky setups.
Case Study 3: Crypto & Altcoin Trades
The oscillator isn’t limited to equities. Many traders successfully apply it to cryptocurrencies. For example, when Bitcoin fell below $30,000 in 2023, the daily stochastic hit oversold conditions. Shortly after, the price reversed higher, aligning with growing demand from institutional buyers. Similarly, altcoins like Ethereum often present oversold signals before major rallies.
External Resource: Market professionals often cite the value of stochastic indicators in spotting crypto momentum shifts. Explore MarketWatch for updated technical insights across stocks and digital assets.
Key Learning: In each case — Tesla, penny stocks, and crypto — the stochastic oscillator gave an early clue to momentum shifts. While not perfect, it provided traders with an objective edge in timing volatile markets.
“Trading success is about probabilities, not certainties.” – Professional Trader
📌 Key Takeaway
The stochastic oscillator helps traders act on momentum signals before the crowd. Whether it’s a blue-chip stock like Tesla, a volatile penny stock, or Bitcoin, this tool offers consistent insights into when prices may reverse or continue their trend.
5. Pros and Cons of Using the Stochastic Oscillator
Every indicator has strengths and trade‑offs. The stochastic oscillator is a powerful momentum tool, but it performs best when you understand where and how to deploy it. Use the checklist below to decide when to feature it at the center of your playbook—and when to treat it as a supporting signal.
✅ Advantages
- ✅ Fast momentum insight: %K/%D crossovers often lead price-based signals like moving averages.
- ✅ Clear extremes: Overbought/oversold bands (80/20) make it simple to spot potential turning points.
- ✅ Versatile across markets: Works on stocks, ETFs, forex, crypto, and commodities.
- ✅ Multi-timeframe friendly: Align higher‑timeframe bias with lower‑timeframe entries for stacked probabilities.
- ✅ Pairs well with structure: Trend, support/resistance, and swing trading techniques boost signal quality.
❌ Limitations
- ❌ Whipsaws in strong trends: Price can stay “overbought/oversold” for long stretches during momentum runs.
- ❌ Not a standalone system: Requires confirmation (RSI, price action, volume) to filter false signals.
- ❌ Parameter sensitivity: Short lookbacks (e.g., 5–9) are very reactive; 14–21 are smoother but slower.
- ❌ Range‑bound bias: Performs best in sideways/rotational phases—less so in parabolic moves.
- ❌ Psychological traps: Traders may over‑anticipate reversals instead of letting price confirm.
When to Lean In vs. When to Dial Back
- Lean In: Range‑bound markets, post‑earnings digestion, base‑building phases, channel trading.
- Dial Back: News‑driven breakouts, one‑way trend days, thin liquidity names without orderly pulls.
For a broader decision framework on indicator selection, see our primer on the best indicators for swing trading and how to match tools to market regime. If you’re vetting whether an instrument even fits your style and risk tolerance, review how to tell what stock is suitable for you.
“Indicators don’t predict the future—they frame the odds. Your edge is in how consistently you apply the rules.”
For charting and rule‑testing, many traders practice on robust platforms with indicator overlays and replay features. Explore TradingView to simulate entries/exits and tag outcomes for a proper playbook.
| Aspect | Verdict | Notes |
|---|---|---|
| Signal Speed | ✅ Fast | Often leads MA signals; great for timing pullbacks. |
| Trend Environments | ❌ Mixed | Can fade trends too early—use with a trend filter (e.g., 200‑day MA). |
| Ease of Use | ✅ Simple | Clear bands/crossovers—friendly for newer traders. |
| False Signals | ❌ Possible | Reduce with confluence (RSI, volume, S/R) and multi‑timeframe checks. |
📌 Key Takeaway
Use stochastic as a trigger, not a thesis. It excels at timing within ranges and pullbacks, but it needs context—trend, levels, and confirmation. Pair it with structure and risk rules to transform fast signals into reliable trades.
6. Expert Opinions & Interviews
The stochastic oscillator has endured for decades because experts continue to validate its usefulness. By blending statistical insight with trader psychology, it remains a cornerstone indicator. Let’s hear what professionals and thought leaders say about its role in modern markets.
George Lane — The Original Voice
George Lane, the developer of the stochastic oscillator, famously said that “the stochastic measures the momentum of price. Momentum changes direction before price.” This insight has guided generations of traders, reminding them that indicators like stochastic should be used to anticipate potential turns, not chase trends.
Professional Trader Insights
Seasoned day traders often rely on stochastic crossovers to confirm timing within broader strategies. For instance, a crossover below 20 in a stock that’s building support may signal a low-risk entry point. In interviews, traders emphasize the importance of confluence—waiting until stochastic agrees with support/resistance, candlestick patterns, or volume surges.

Experts highlight how the stochastic oscillator helps validate momentum shifts before price action confirms.
Institutional Perspectives
Institutional analysts often combine stochastic with broader frameworks like Bollinger Bands, MACD, or volume profiles. Their focus is not on one indicator, but rather how multiple signals align to improve the probability of success. For instance, a stochastic recovery from oversold that coincides with a Bollinger Band squeeze can indicate both momentum and volatility expansion are aligning.
In our own mentoring sessions, we often stress this point: having a mentor who demonstrates how to combine stochastic with other signals is invaluable. It prevents over-reliance on one tool and instills discipline in applying indicators properly.
“Momentum indicators are like the heartbeat of the market. They don’t tell you the whole story, but they alert you when something changes.” – Senior Hedge Fund Analyst
Expert Interviews Highlight
When asked about stochastic, many pros point out that its biggest strength is simplicity. Unlike complex quantitative models, the stochastic oscillator is easy to interpret yet effective. According to analysts at the CFA Institute, simple tools like stochastic are invaluable for training new analysts in momentum theory before they advance to more complex models.
Retail Trader Lessons
For everyday traders, the oscillator teaches patience. Many admit that before using stochastic, they jumped into trades too early. By waiting for stochastic confirmation, they improved timing and reduced losses. Combining stochastic with resources like day trading strategies helps new traders bridge the gap between theory and execution.
📌 Key Takeaway
Experts agree: the stochastic oscillator is most effective in context. It should never be the only tool in a trader’s kit, but when paired with structure, trend filters, and discipline, it delivers valuable early signals that improve decision-making.
7. FAQs & Final Thoughts
As we wrap up this deep dive into the stochastic oscillator, let’s tackle the most common questions traders ask. These FAQs provide clarity on how to use this indicator effectively and responsibly in today’s markets.
❓ What does the stochastic oscillator measure?
The stochastic oscillator measures the position of the closing price relative to the recent high-low range over a set period (commonly 14 days). It reveals whether momentum is pushing the price toward the higher or lower end of that range.
❓ Is the stochastic oscillator better than RSI?
Not necessarily. The stochastic is more sensitive and reacts faster, while RSI is smoother and filters noise. Many traders combine both for confirmation. For example, when both indicators agree on oversold conditions, it’s often a stronger signal.
❓ What is the best timeframe to use?
The standard setting is 14 periods, but traders adapt depending on style. Day traders may use 5–9 periods for faster signals, while swing traders prefer 14–21 for smoother insights. Always backtest settings with your strategy before going live.
❓ Can the stochastic oscillator be used for crypto?
Yes. Many apply it to crypto markets like Bitcoin and Ethereum. The fast-moving, momentum-driven nature of crypto often makes stochastic signals even more useful when paired with volume analysis.
❓ Should I rely on stochastic alone?
No. Experts consistently stress that it should be one part of a broader strategy. Use it with price action, trend filters, and risk management for best results.
For further learning, see our resources on stock market trading courses for beginners and how to identify bad stock news—both of which help you apply technical indicators in context.
For authoritative insights, CoinTelegraph provides ongoing crypto analysis where stochastic indicators are often applied in technical breakdowns.
The stochastic oscillator remains a proven, reliable, and versatile tool for traders across markets. By showing whether momentum is cooling or heating up, it provides a valuable second opinion before pulling the trigger on a trade. Used alone, it can generate false signals; but combined with trend, structure, and discipline, it becomes a key part of a trader’s edge.
“An indicator doesn’t make the trade for you—it helps you trade with greater clarity.” – Veteran Trader
📌 Key Takeaway
The stochastic oscillator is best seen as a probability enhancer. It sharpens entries and exits but must be paired with structure and risk rules. Treat it as one piece of a puzzle, not the whole picture, and you’ll trade with greater confidence.
🔗 High-Authority Resources
For traders who want to dig deeper, here are trusted resources that expand on topics covered in this guide:
📘 Investopedia: Stochastic Oscillator
A clear explanation of the indicator’s formulas, signals, and trading applications.
📊 Yahoo Finance Technicals
Live market charts, technical indicators, and community insights for active traders.
💹 MarketWatch Analysis
Real-time stock news, technical commentary, and institutional perspectives.
₿ CoinTelegraph Crypto Analysis
Learn how traders apply stochastic and other indicators to Bitcoin and Ethereum charts.
🎓 CFA Institute Research
Educational content from one of the most trusted authorities in global finance and investing.
📈 TradingView Charting Tools
Test stochastic strategies with replay mode, advanced charting, and custom screeners.