- The Power of Swing Trading Techniques
- Technique #1: Mastering Breakout Setups
- Technique #2: The Moving Average Bounce
- Technique #3: Using RSI for Perfect Timing
- Technique #4: Support & Resistance Zones
- Technique #5: Volume + Price Action Confirmation
- Technique #6: Risk-Reward Ratio That Works
- Technique #7: Journaling & Trade Reviews
📌 The Power of Swing Trading Techniques
Why do some traders consistently win while others struggle? It usually comes down to one thing: they follow a clear, repeatable technique — not a feeling or guess.
Swing trading is about capturing moves that play out over 1–10 days. But unless you have a game plan, you’re just reacting. That’s where structured techniques come in — they help you enter with purpose, not panic.
At TradeStockAlerts, we’ve seen time and again that traders who follow process-driven techniques grow their accounts faster and avoid emotional damage:contentReference[oaicite:0]{index=0}.
“Amateurs trade outcomes. Pros trade setups.”
— Mark Minervini
So if you’re ready to turn your trades into predictable, data-backed decisions instead of emotional reactions, this guide is for you. Let’s jump in.
🟩 Technique #1: Mastering Breakout Setups
The breakout is a classic — and for good reason. It’s when price explodes past a resistance level after consolidating. But not all breakouts are created equal. Some fake out and trap you. Others deliver clean, powerful moves.
Here’s what winning breakout trades usually have in common:
- ✅ A multi-day or multi-week base
- ✅ Tight price action leading into the breakout
- ✅ A clear level being breached
- ✅ Volume expansion on the move
$PLTR formed a wedge over 2 weeks. The breakout happened at $21.40 with 2.4x average volume. Target was $23.80 and it hit in 3 days.
But breakout failure is real. Entering too early, without volume, or during choppy conditions can lead to whipsaws and quick losses. The solution? Combine volume and structure.
Compare the difference visually using our most popular blog on swing trading setups that actually work:contentReference[oaicite:1]{index=1}.
- ✅ Fast price acceleration = quick profits
- ✅ Easy to spot on charts
- ✅ Great with clear risk levels
- ❌ Prone to fakeouts without volume
- ❌ Late entries = poor R/R
- ❌ Choppy markets ruin setups
Looking for deeper insights? Investopedia’s guide to chart patterns is a timeless resource for identifying breakouts from flags, wedges, and bases.
— Bryce Welker, technical analyst
🟦 Technique #2: The Moving Average Bounce
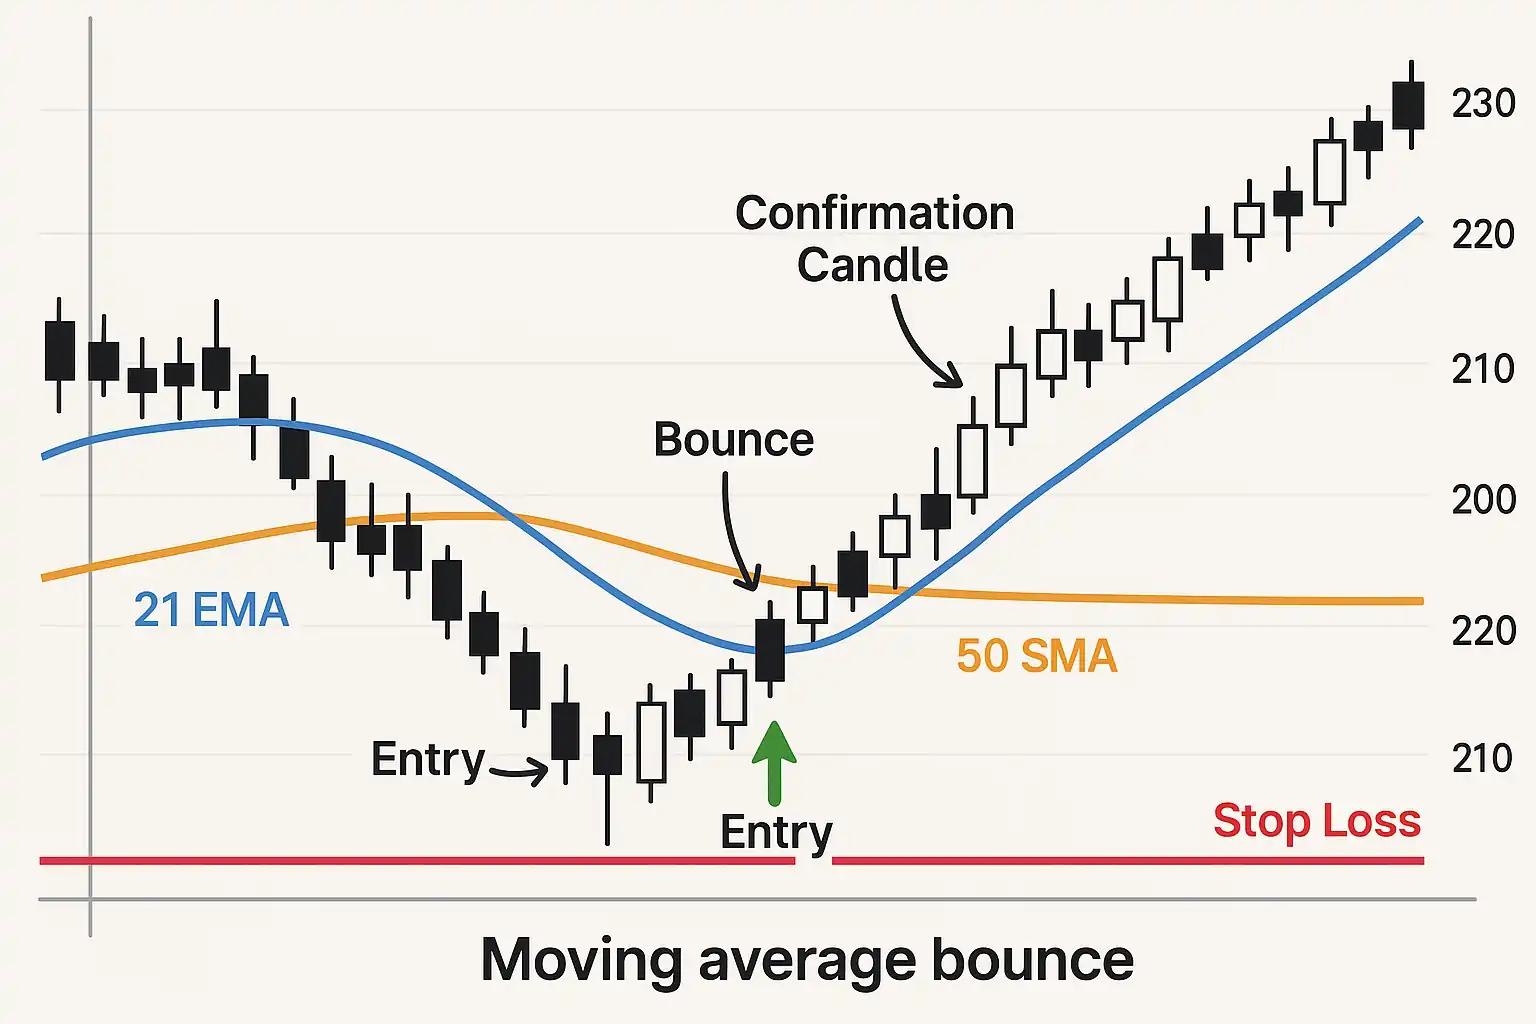
One of the most reliable techniques in swing trading is the moving average bounce. It’s simple, repeatable, and highly visual — which is why it’s a favorite among pro traders.
This method involves buying a stock as it “bounces” off a dynamic support level, like the 21 EMA or the 50 SMA. Instead of chasing momentum, you’re waiting for a pullback that confirms the trend is intact.
Here’s how it works:
- ✅ Identify an uptrend with higher highs and higher lows
- ✅ Wait for price to pull back to the 21 EMA or 50 SMA
- ✅ Enter on a confirmation candle (e.g., bullish engulfing)
- ✅ Place stop-loss just under the moving average
“Moving averages are not just trend indicators. They’re behavioral levels where institutions often buy dips.”
— Linda Bradford Raschke
Let’s look at a real-world application:
In March, $SOFI pulled back to its 21 EMA after a multi-day rally. A bullish engulfing candle appeared the next day. Entry was at $7.15, with target $7.90 — a clean 10% move in 4 sessions.
You can view similar trade alerts in action on our Swing Trading Alerts dashboard — where members use EMAs and SMAs to time entries in real time:contentReference[oaicite:0]{index=0}.
- ✅ Great for trending markets
- ✅ Easy visual confirmation
- ✅ Supports precise entries and tight stops
- ❌ Fails in choppy or sideways markets
- ❌ Needs volume confirmation
- ❌ Can lead to early exits without patience
Want to go deeper into moving average theory? TrendSpider’s guide explains how different averages behave under volatility.
“The 50 SMA is a dynamic buy zone — especially when volume holds. Wait for confirmation before entering.”
— Brian Lund, Swing Trader & Educator
🟨 Technique #3: Using RSI for Perfect Timing
Traders love the RSI because it’s fast, visual, and powerful — but only when used correctly. The Relative Strength Index (RSI) helps you spot when a stock is overbought or oversold, giving you a potential edge in timing entries and exits.
How RSI Works:
- 🔵 RSI above 70 = overbought (possible reversal or pullback)
- 🔵 RSI below 30 = oversold (possible bounce or reversal)
- 🔵 Ideal range for swing traders: 30–70 with confirmation from price action
Many traders make the mistake of buying just because RSI hits 30. But RSI by itself can give false signals. The real power comes from combining RSI with trend context and price structure.
“The RSI is a lie… unless paired with structure and volume.”
— Oliver Kell, US Investing Champion
Case Study: In late June, $SMCI’s RSI dropped to 29. It hit support on the daily chart, then printed a bullish engulfing candle. Entry was triggered at $880. Within 4 sessions, the stock surged to $1,010 — a 14% swing backed by RSI and price confirmation.
Using RSI this way helps you time reversals with confidence rather than guessing bottoms or tops.
Our deep dive into swing trading methods explains how RSI works in both trend continuation and mean-reversion setups:contentReference[oaicite:0]{index=0}.
- ✅ Great for timing reversals and entries
- ✅ Easy to read and interpret visually
- ✅ Works on all timeframes
- ❌ High false signals in sideways markets
- ❌ Overbought ≠ reversal during strong uptrend
- ❌ Needs confirmation to avoid traps
For a real-world perspective on indicator risk, FINRA’s investor insight article highlights why relying solely on technical indicators like RSI can be dangerous without context.
Combine RSI with price structure, volume, and trend direction. Don’t use it in isolation — use it to support your thesis, not build one.
🟦 Technique #4: Support & Resistance Zones
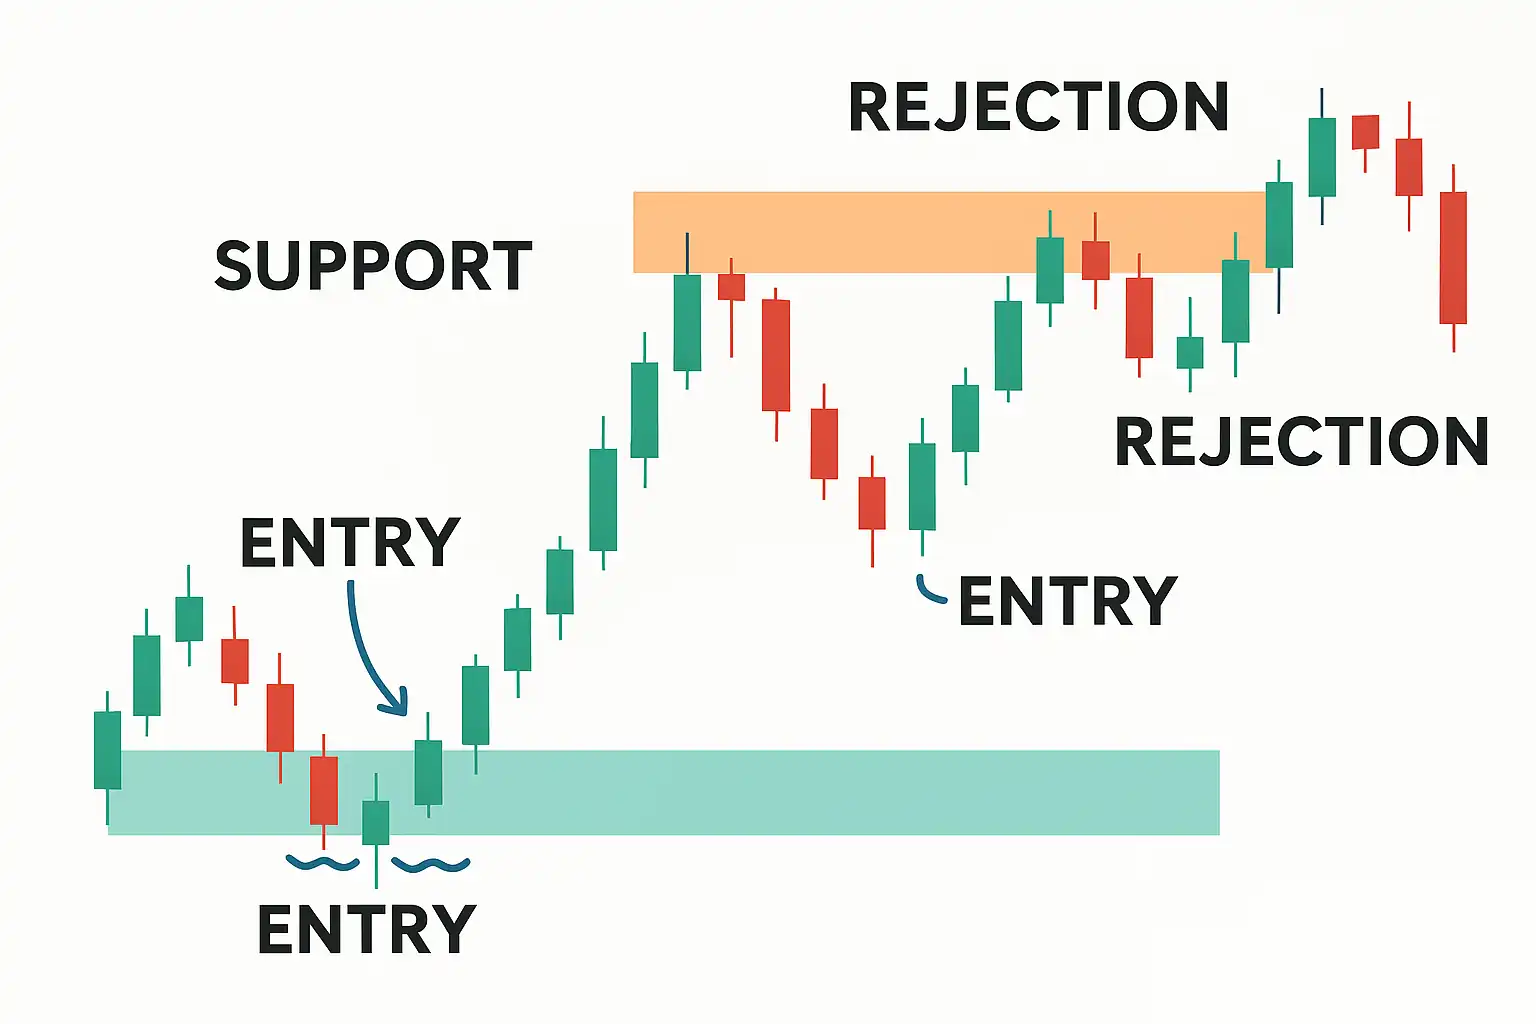
Support and resistance are two of the oldest — and most effective — concepts in trading. But the key isn’t drawing perfect lines. It’s identifying zones where buyers or sellers consistently step in.
Here’s how to approach them like a pro:
- 📍 Treat support/resistance as areas, not exact price points
- 🕒 Use higher timeframes (daily, weekly) to spot key zones
- 📊 Look for clustering of wicks, failed breakouts, or volume spikes
Zones work because they reflect real trader behavior — institutions buying dips, short sellers entering at tops, and traders reacting to prior pivots.
“Support is where fear turns into courage. Resistance is where greed gets tested.”
— Anne-Marie Baiynd, Technical Analyst
Case Study: $META tested the $300 resistance level 4 times between April and May. On the fifth test, it broke through with high volume — launching to $323 in 2 sessions. Traders who marked that zone ahead were prepared.
To learn the fundamentals of how support/resistance works with real price movement, visit our post: What Are Stocks?:contentReference[oaicite:0]{index=0}
- ✅ Easy to spot with practice
- ✅ Ideal for swing trade entries and exits
- ✅ Combine well with candlestick signals
- ❌ Can be subjective or misdrawn
- ❌ Easily broken in high-volatility news
- ❌ Doesn’t guarantee reversal
Looking for a clear breakdown on how support/resistance shapes trades? Benzinga’s visual guide shows real chart examples and how traders use zones in active markets.
“If a level has been tested 3+ times, it’s more likely to break — so prepare your setup, not your hope.”
— Bryce Welker, Price Action Strategist
🟧 Technique #5: Volume + Price Action Confirmation
One of the biggest mistakes swing traders make is entering a trade based solely on chart patterns — without checking volume. Volume tells you whether a price move is real… or just noise.
When volume confirms a breakout, reversal, or continuation pattern, your chances of success go up significantly. Without it? You’re guessing — and that’s never a strategy.
What to Look For:
- 🔹 Breakouts with 2x+ average volume
- 🔹 Volume spike accompanying bullish candles (e.g., hammer, engulfing)
- 🔹 Decreasing volume in pullbacks = likely continuation
“Price shows you what’s happening. Volume tells you who’s involved.”
— Rayner Teo, Trader & Author
Case Study: $ANET formed a bull flag over 3 sessions. On breakout, volume jumped to 3x daily average. Entry at $334, exit at $351 = +5% swing in 48 hours.
This trade was posted inside our chat and mirrored in our full breakdown on how volume impacts price action:contentReference[oaicite:0]{index=0}.
- ✅ Validates price action strength
- ✅ Helps avoid false breakouts
- ✅ Reveals institutional activity
- ❌ Volume can lag price slightly
- ❌ Some spikes are news-driven noise
- ❌ Harder to read on low-float stocks
Using volume in your swing trading strategy gives you the confidence to enter only when the crowd — and smart money — is moving with you.
📘 SEC’s guide to interpreting volume data is a helpful reference for understanding volume-based confirmations and why they matter for active traders.
🟦 Technique #6: Risk-Reward Ratio That Works
If there’s one swing trading principle that separates pros from amateurs, it’s this: never risk more than you’re willing to lose — and always aim to gain more than you risk.
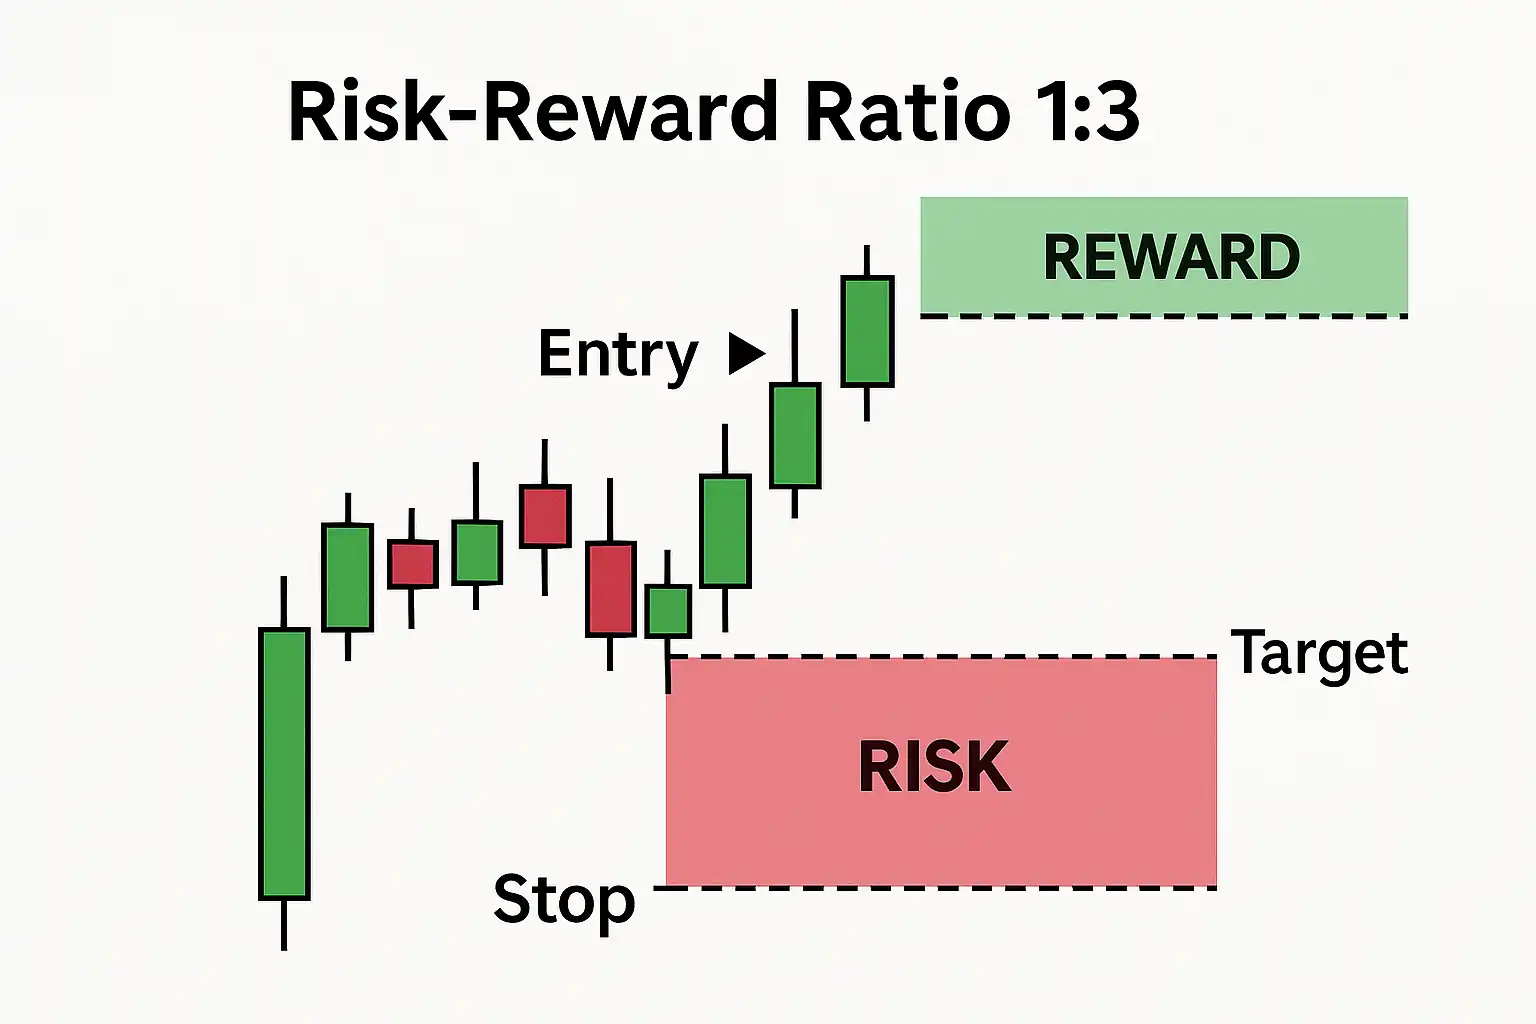
That’s the power of the risk-reward ratio (RRR). A 1:3 RRR means you risk $100 to potentially make $300. If you’re wrong 50% of the time, you still win over time.
Winning swing traders are not right more often — they lose smaller and win bigger.
- 🟢 1:2 minimum RRR for most trades
- 🔴 Cut losses quickly at pre-defined stop-loss
- 🧮 Use position sizing calculators for consistency
“It’s not about being right — it’s about being profitable.”
— Mark Douglas, Author of Trading in the Zone
Let’s look at a real example:
$PLTR setup: Entry at $22.00, stop-loss at $21.40 (risk = $0.60), target = $23.80 (reward = $1.80). Result: RRR = 1:3. Trade completed in 4 sessions and hit target.
Want to know how we use this logic in real trades? Visit our side-by-side comparison of day vs. swing trading strategies to see how risk scales in both styles:contentReference[oaicite:0]{index=0}.
- ✅ Builds consistent profitability over time
- ✅ Prevents emotional overtrading
- ✅ Allows more losing trades without losing money
- ❌ May miss out on small quick gains
- ❌ Requires discipline and planning
- ❌ Some setups don’t offer great RRR
Need help understanding how to visually measure risk/reward before you enter a trade? TradingView’s risk/reward analysis tool is a powerful visual aid for new traders.
“If you aren’t defining your risk before the trade, you’ve already lost.”
— Brian Shannon, Author of Technical Analysis Using Multiple Timeframes
🟩 Technique #7: Journaling & Trade Reviews
Most traders obsess over entries and exits — but ignore what really leads to long-term improvement: journaling and reviewing your trades.
Keeping a trading journal helps you identify patterns, correct mistakes, and refine your setups over time. It transforms guesswork into measurable growth.
What to Track in a Swing Trade Journal:
- 🕐 Entry/exit price, time, and ticker
- 🎯 Reason for entry (setup, catalyst, support, etc.)
- 📉 Risk-reward ratio and position size
- 🧠 Emotions or hesitation before/after execution
- 🔁 Result: profit/loss, and post-trade review
“Your best teacher is your last trade.”
— Mike Bellafiore, SMB Capital
Case Study: A TradeStockAlerts user named James journaled every trade for 30 days. He discovered that trades placed in the first 20 minutes of the market underperformed by 40% compared to entries after 10:15 AM. He adjusted his approach — and his win rate jumped from 54% to 68% in the following month.
You can automate this process using software like TraderSync, Edgewonk, or our own Swing Trade Bot, which allows you to tag entries, measure R values, and review trade psychology with every alert you follow:contentReference[oaicite:0]{index=0}.
- ✅ Tracks mistakes and wins for future reference
- ✅ Improves trade consistency and mindset
- ✅ Helps develop edge and avoid repeated errors
- ❌ Requires time and discipline
- ❌ Difficult for traders who skip documentation
- ❌ Overanalysis can lead to second-guessing
Need a structured method to log your trades? Try Warrior Trading’s guide to creating a trading journal and see how it can enhance your performance without needing fancy tools.
“The journal is your mirror — if you don’t look into it, you’ll never see what’s holding you back.”
— Kunal Desai, Trader & Educator
🔑 Key Takeaways
- ✅ Stick to structured, proven swing trading techniques — not emotion.
- ✅ Combine indicators like RSI and volume with price action and trend context.
- ✅ Use support/resistance zones, moving averages, and risk/reward filters before entering.
- ✅ Keep a journal. You can’t improve what you don’t track.
- ✅ Each trade should be intentional — with setup, sizing, and outcome review.
❓ Frequently Asked Questions
What’s the best swing trading indicator?
How long should a swing trade last?
Is swing trading good for beginners?
Can I swing trade with $1,000?
Do I need a trading chat room or alerts service?
🌐 High-Authority External Resources
Technical Chart Patterns Explained
Learn the foundations of technical breakouts, flags, and triangles.
Support & Resistance: The Core of Technical Trading
Master real-world zone identification with visuals.
Risk/Reward Strategy Tools
Visualize stop-loss and target setups across different chart types.
📚 Further Reading
- Full Swing Trading Techniques Resource
- Swing Trading Setups That Actually Work
- Real Trader Stories: $1K to $10K
- Join Our Swing Trading Alerts Room
🌐 High-Authority External Resources
Chart Patterns Every Trader Should Know
Foundational technical patterns for swing and momentum traders.
Support & Resistance Simplified
Learn to identify trading zones with real chart examples.
Master Risk/Reward Visualization
Tools to chart ideal stop-loss and target placement for swing trades.
Understand the Risks of Indicator Trading
Why relying only on RSI, MACD, or other tools can mislead you.