Standard Doji
Tiny body, short-to-moderate wicks both sides. A classic indecision pause. Near resistance after an up-leg → watch for momentum fade; near support in a downtrend → potential stall.
Why a tiny real body can carry heavyweight information
A Doji appears on a candlestick chart when the opening and closing prices are nearly identical. The result is a candle with a very small real body (often a thin cross), sometimes with upper and/or lower shadows. This visual compresses a full period of price discovery into a single message: indecision. Buyers and sellers pushed and pulled, but finished roughly where they started.
Importantly, a Doji’s meaning is context‑dependent. In an extended uptrend, a Doji can warn that bullish momentum is slowing (potential reversal or pause). In consolidation, it may simply confirm a balanced tug‑of‑war. The candle itself is not a signal to trade; it is a signal to focus and seek confirmation from trend, support/resistance, and volume.
Volume adds essential context. A conspicuous Doji on elevated volume often indicates a fierce intraperiod battle that failed to resolve—the kind of pressure that can precede an outsized move once an imbalance emerges. Learn how volume impacts price action here: How a Stock’s Volume Can Affect Its Price:contentReference[oaicite:0]{index=0}.
Inspiration: “In trading, patience isn’t inactivity—it’s focus. A Doji invites you to pay attention.”
Bottom line: a Doji is a context cue, not a standalone “buy/sell” button.
Next up: the psychology that creates a Doji—why buyers and sellers stalemate and how to read that standoff.
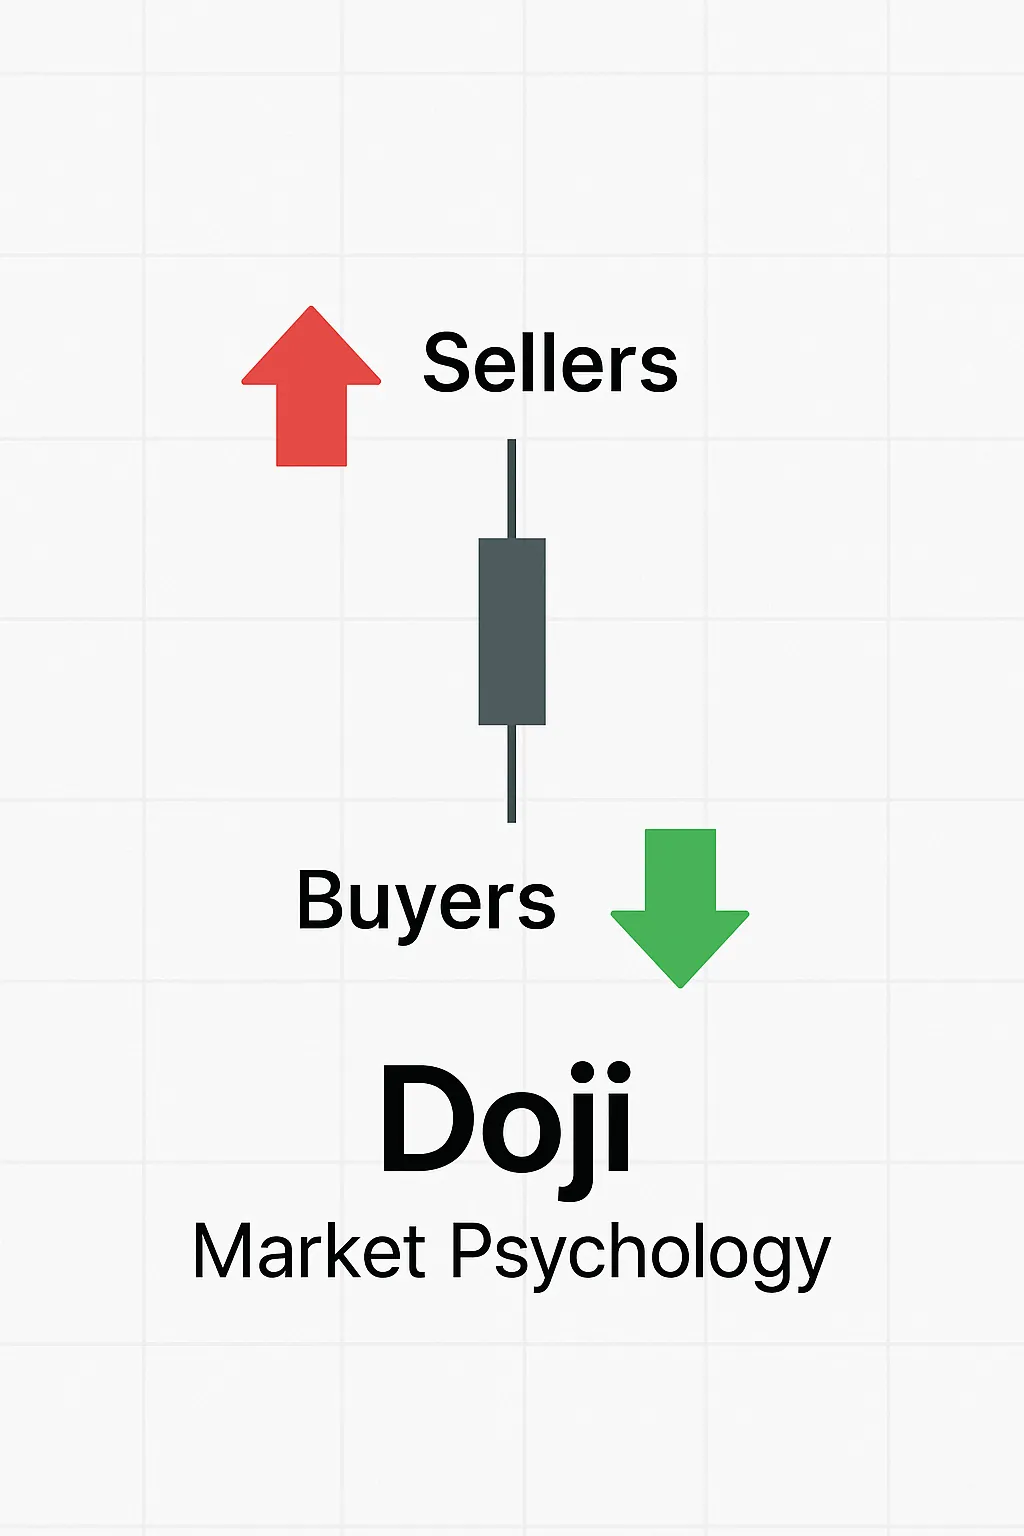
Why buyers and sellers fight to a standstill — and what that standoff really tells you
A Doji is the market’s confession of uncertainty. During the period, bulls test higher prices and bears test lower prices, yet neither side can close the session in control. The open ≈ close isn’t randomness; it’s a balance-of-power message that only makes sense in context — the prevailing trend, nearby support/resistance, and volume.
In short uptrends, a Doji near resistance can hint at momentum fatigue. In downtrends, a Doji at support can signal short‑covering pressure. In ranges, it’s often a status update that equilibrium still holds. The same shape means different things depending on where it appears.
Your interpretation should also reflect your timeframe and style. A scalper reacts differently than a swing trader; compare frameworks here: Day Trading vs Swing Trading:contentReference[oaicite:0]{index=0}. To anchor your decision‑making in core principles, review Fundamentals of Stock Market Investing:contentReference[oaicite:1]{index=1}, and see why predicting markets is hard (and why confirmation matters) in How Difficult Is It to Predict the Stock Market?:contentReference[oaicite:2]{index=2}. When headlines get noisy, use structured filters: Cut Down on the Noise of the News:contentReference[oaicite:3]{index=3}.
Inspiration: “The Doji doesn’t whisper ‘buy’ or ‘sell’—it whispers ‘look closer.’”
Long upper shadows imply failed rallies (sellers defended higher prices). Long lower shadows suggest absorption of selling (buyers stepped in). Equal‑length wicks indicate balanced probing. None of these are signals alone; they’re breadcrumbs pointing to where effort was applied and where it was absorbed.
Think of a Doji as a decision pending — not a decision made.
Ready to apply the psychology to specific shapes? Jump to the most common Doji types and what they signal.
Same body, different stories — how wick length, location, and volume change the message
Not all Dojis speak with the same voice. The real body is tiny in every case (open ≈ close), but the shadows (wicks) and context reshape meaning. Below are the most common variations and what they often imply when combined with trend, levels, and volume.
Tiny body, short-to-moderate wicks both sides. A classic indecision pause. Near resistance after an up-leg → watch for momentum fade; near support in a downtrend → potential stall.
Long upper and lower shadows with a tiny body. Big intraperiod swings, no control at the close. On elevated volume, it often precedes a powerful resolution once one side gains the upper hand.
Open ≈ Close at/near the high with a long lower shadow. Intraperiod selling was absorbed and price finished strong. At support after a decline, it can hint at buying interest (seek confirmation on next bars/volume).
Open ≈ Close at/near the low with a long upper shadow. Intraperiod buying was rejected. At resistance after a rally, it can warn of supply overhead (again, wait for confirmation).
Open = High = Low = Close (a flat line). Extremely rare. Indicates a very tight, illiquid, or paused market. Usually requires higher‑timeframe context; don’t trade it in isolation.
For tools to confirm Dojis, see the Best Indicator for Swing Trading:contentReference[oaicite:0]{index=0}, and build structured entries with Swing Trading Setups:contentReference[oaicite:1]{index=1}. If you prefer a broader framework, review Swing Trading Methods:contentReference[oaicite:2]{index=2}.
Pattern Principle: “The Doji’s power isn’t the cross—it’s the context wrapped around it.”
Ready to see these patterns in action? Continue to practical, real‑market examples where Dojis preceded major moves.
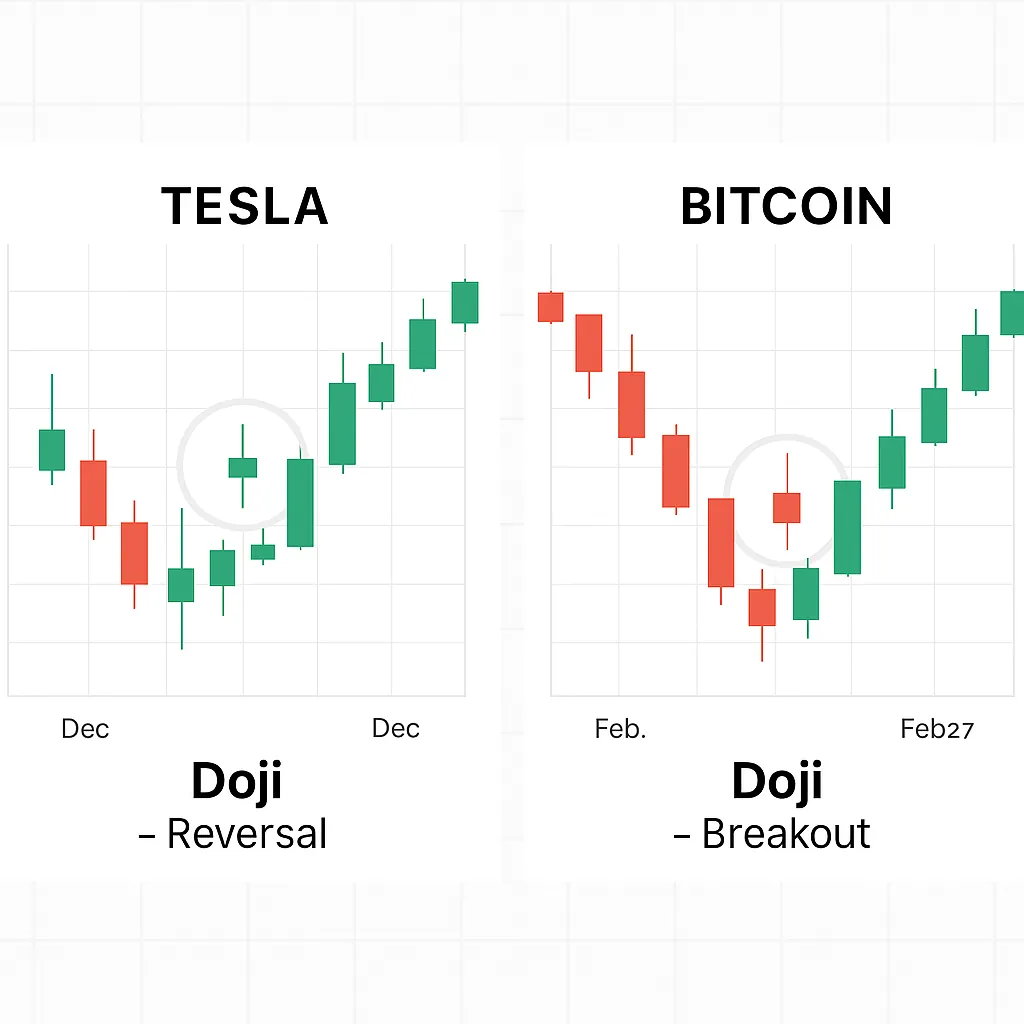
From Tesla to Bitcoin — how Dojis flagged turning points before the crowd noticed
A Doji may seem subtle, but when paired with context it can be the clue that separates a disciplined trader from a reactive one. Let’s look at historical examples where a Doji signaled critical shifts in market direction — and how confirmation turned the pattern into a profitable opportunity.
In July 2020, Tesla’s daily chart printed a Long-Legged Doji after an extended rally. Volume spiked, indicating aggressive two-way trade. The following session broke below the Doji’s low on heavy volume — a textbook bearish confirmation that preceded a multi-week retracement. Traders who set stop-losses just above the high risked little compared to the potential reward.
You can explore similar setups using your preferred charting platform, or study historical data directly: Yahoo Finance — Tesla Historical Data (dofollow). For a comparison of intraday vs swing responses to such patterns, see Day Trading vs Swing Trading:contentReference[oaicite:0]{index=0}.
In October 2023, Bitcoin formed a Dragonfly Doji at a long-term support zone near $26,000. The long lower shadow reflected selling absorption, and the close near the high hinted at hidden buying pressure. When BTC broke above the Doji’s high the next day on surging volume, it kicked off a rally above $30,000.
For forward-looking analysis of Bitcoin and other crypto markets, see Bitcoin Price Predictions:contentReference[oaicite:1]{index=1} and learn how predictive models handle volatile assets.
Case Study Wisdom: “A Doji doesn’t hand you profits — it hands you a map. You still have to take the journey.”
Now, let’s hear from the experts — traders who’ve built consistent strategies around Dojis — in the next section.
What seasoned traders see in a Doji that beginners often miss
The Doji candlestick has earned a reputation as a subtle yet powerful pattern in technical analysis. To understand its real-world application, we spoke to professional traders, analysts, and mentors who have integrated Doji recognition into their daily decision-making. Their insights reveal nuanced interpretations that go beyond the textbook definition.
John Keller, Veteran Swing Trader: “The market talks in patterns — you just have to learn its language. A Doji in the wrong context is meaningless. But at the right spot, with volume to back it, it’s like hearing the market clear its throat before it speaks.”
Keller emphasizes that Dojis are alerts rather than commands. His approach involves mapping them against key support and resistance zones, then seeking confirmation through momentum indicators and market breadth.
Melissa Chan, Proprietary Day Trader: “For me, a Doji is a decision point. If it forms near VWAP with strong tape action, I’m on high alert. It doesn’t matter if it’s a reversal or continuation — what matters is that the market just hesitated, and that hesitation often leads to movement.”
Chan pairs Dojis with time & sales and order flow tools to gauge trader commitment immediately after the candle forms. This rapid read helps her execute within seconds of confirmation.
David López, Trading Mentor: “I teach my students to treat the Doji like a yellow traffic light. You don’t slam the accelerator — you prepare. You look at the whole intersection: trend, volume, news, and where you are on the chart.”
López focuses on the discipline aspect, teaching traders to slow down when a Doji appears and avoid impulsive entries.
For live trade examples using this approach, review our Swing Trading Alerts:contentReference[oaicite:0]{index=0}. Day traders can enhance their timing with the tools in Day Trading Alerts:contentReference[oaicite:1]{index=1}.
With expert perspective in mind, we can now explore practical Doji trading strategies that incorporate these insights for higher win rates.
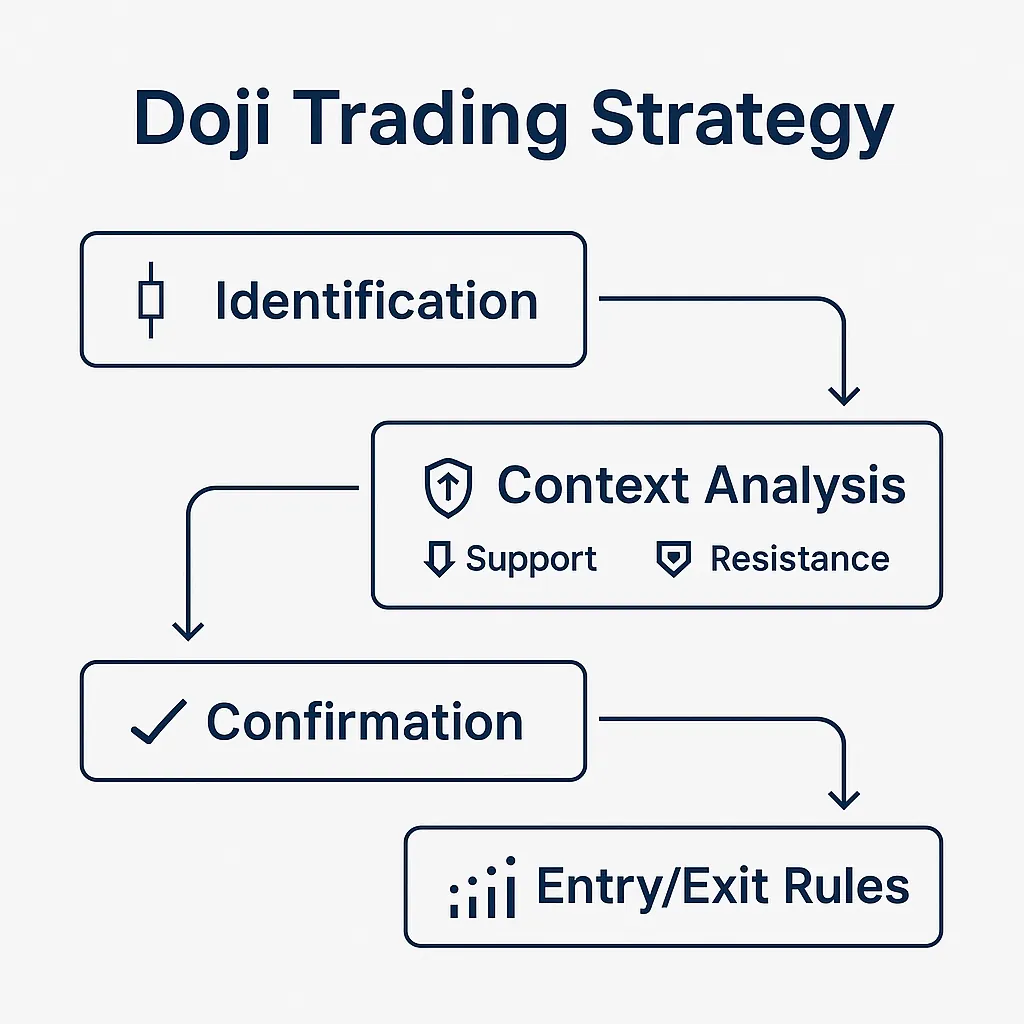
Turning indecision into opportunity with confirmation and risk control
A Doji candlestick is not a trading signal by itself — it’s a trigger for deeper analysis. The best traders combine Doji recognition with other technical tools, a clear entry/exit plan, and disciplined risk management. Below are three high-probability strategies that have stood the test of time.
Identify a Doji at or near a key support/resistance level. Wait for the next candle to close beyond the Doji’s high or low. This breakout acts as your entry trigger. Use the opposite extreme of the Doji as your stop-loss point.
Pair the Doji with momentum oscillators like RSI or MACD. A Doji signaling indecision combined with oversold/overbought readings can strengthen reversal probabilities. Only take trades when volume supports the directional move.
In strong trends, Dojis can mark pauses before continuation. Look for a Doji that forms within a trend channel or near moving averages. When the price resumes in the direction of the trend on strong volume, it can offer a lower-risk entry.
For more trade alert setups like these, explore our Day Trading Alerts:contentReference[oaicite:0]{index=0} and Swing Trading Alerts:contentReference[oaicite:1]{index=1}. You can also refine your entries using the Best Indicator for Swing Trading:contentReference[oaicite:2]{index=2}.
Trading Insight: “A Doji strategy works when the trader respects the pattern’s patience — and the market’s timing.”
To wrap up, let’s address the most common trader questions and summarize the essential lessons in the final section.
Clearing common doubts and reinforcing the core lessons of Doji trading
Even with expert insights and strategies, traders often have lingering questions about the Doji candlestick. This section answers the most frequently asked questions and consolidates the key points you should remember before applying Dojis in your own trading plan.
In day trading, a Doji signals temporary indecision between buyers and sellers. It’s often a cue to pause, reassess market structure, and wait for confirmation before entering a trade.
By itself, a Doji is neither. Its significance depends on its position in the trend, volume context, and subsequent price action. The candle is best treated as an alert, not an immediate trigger.
Yes — but only with confirmation. For example, a Doji at support followed by a strong bullish candle can be considered bullish. A Doji at resistance followed by a strong bearish candle can be bearish.
To build your skills further, explore our in-depth guides like Penny Stock Alerts:contentReference[oaicite:0]{index=0} and Swing Trading Techniques:contentReference[oaicite:1]{index=1} to see how Doji analysis fits into broader strategies.
Final Thought: “The market rarely shouts; it whispers. The Doji is one of its most important whispers — if you’re listening.”
Apply what you’ve learned here, integrate it into your broader trading toolkit, and track your results. Over time, you’ll know exactly when a Doji is worth acting on — and when it’s just market noise.
Further your understanding of the Doji candlestick and related trading strategies with these trusted sources.
The Doji candlestick pattern is a valuable tool in technical analysis when used in the right market context. Whether you’re a day trader, swing trader, or a long-term investor looking to refine your entries, understanding Dojis can significantly improve your trade timing and risk management. Always combine candlestick patterns with other forms of analysis such as technical indicators:contentReference[oaicite:0]{index=0} and proven trading strategies:contentReference[oaicite:1]{index=1} for the highest probability setups.