💡 Quick Summary: WLGS Gained Over 65% in a Single Session — Here’s the Full Breakdown
Wang & Lee Group (WLGS), a low-float penny stock, exploded over 65% between July 22 and July 23. In this blog, we break down the full alert setup, chart structure, volume breakout, and why it was chosen as our Trade of the Week.
📌 Table of Contents
- Introduction
- What Happened: WLGS Price Movement Overview
- The Setup: Chart, Catalyst, and Volume
- Entry, Exit, and Managing the Trade
- Trader Psychology: Spotting the WLGS Move
- FAQs + Further Reading
🚀 Introduction
Every once in a while, a low-float penny stock defies gravity — and this week, WLGS was that stock.
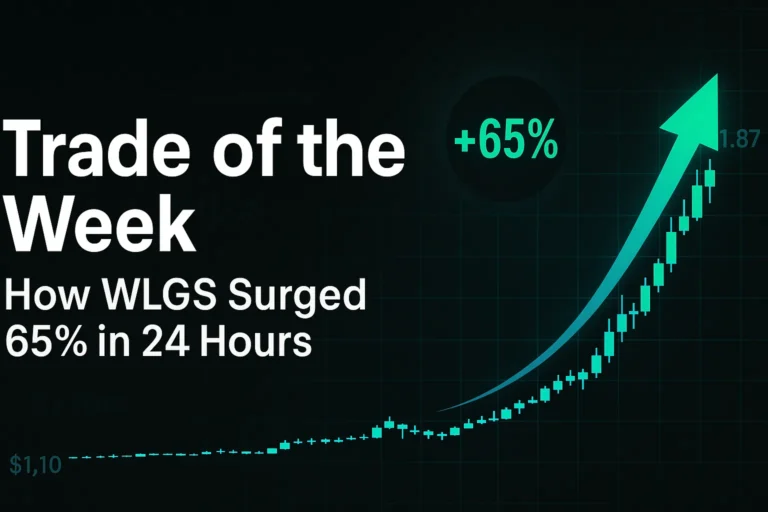
In just under 24 hours, WLGS (Wang & Lee Group) ripped from under $1.10 to over $1.80, delivering a +65% surge on news, momentum, and a perfect setup. For those watching closely, it wasn’t random — it was technical. It was textbook. And yes, it was alerted in real time.
This is your full breakdown: what happened, how it set up, why we took the trade, how we managed it — and how you can learn from it.
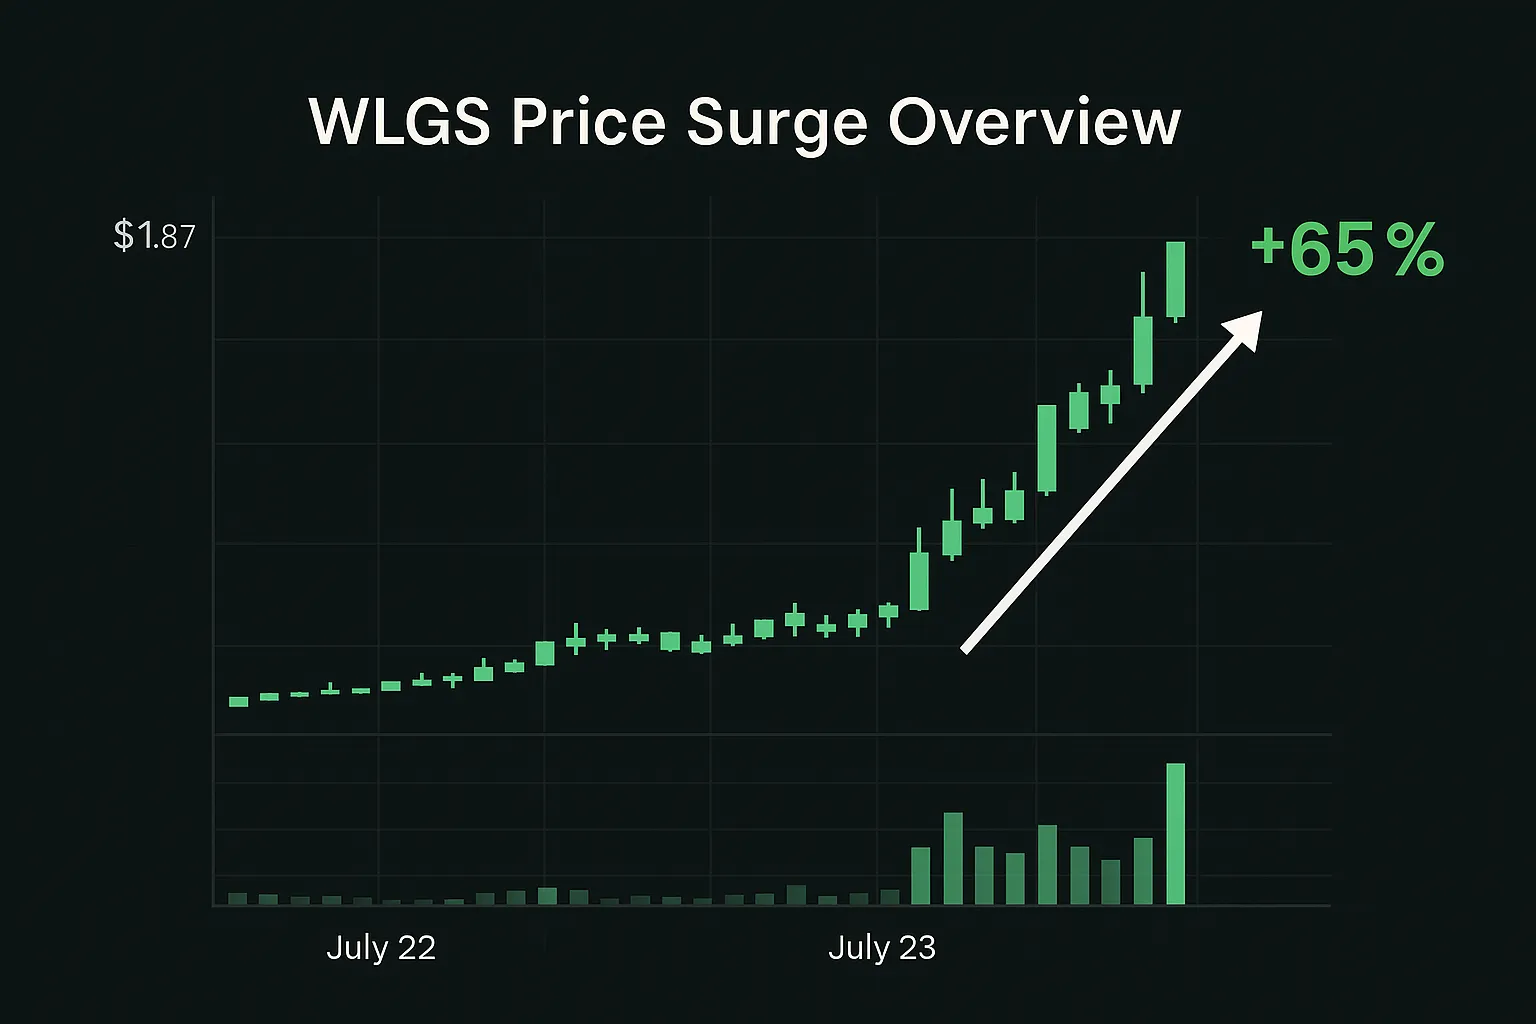
📊 What Happened: WLGS Price Movement Overview
WLGS opened on July 22 trading just above $1.10. There was low premarket volume, no major buzz, and the stock looked quiet. But by midday July 23, it was ripping past $1.80 — on 5x average volume and high momentum scanner alerts.
Day 1 Close (July 22): $1.13
Day 2 High (July 23): $1.87
Move: +65.4%
What triggered the breakout? A classic combination of low float, previous support reclaim, and a subtle catalyst (more on that in Part 2).
To learn how we consistently find these setups, check out our swing trading alerts which include pre-breakout alerts like WLGS.
🏢 What is WLGS? And How It Compares to Big Cap Names
Wang & Lee Group, Inc. (NASDAQ: WLGS) isn’t a household name — and that’s exactly why it moves like it does.
WLGS is a Hong Kong-based engineering and infrastructure firm focused primarily on mechanical and electrical (M&E) services for building construction in Asia. The company went public via IPO in April 2023 and trades on the NASDAQ under the ticker WLGS.
🔍 Basic Stats (As of July 2025)
- Market Cap: Under $20 million
- Float: Estimated under 5 million shares
- Price Range: ~$1.10 to ~$1.90 (high volatility)
- Sector: Infrastructure / Engineering / China Small Cap
This isn’t a stock you analyze with discounted cash flow models or earnings reports. This is a speculative momentum ticker — and it behaves accordingly.
Want to learn how we screen for these low-float rockets? Dive into our shorting strategies primer to understand both sides of the trade.
📈 How It Compares to Bigger Stocks (And Why That Matters)
When you compare WLGS to something like Apple (AAPL), Nvidia (NVDA), or Tesla (TSLA), it’s night and day. Here’s how they differ:
| Factor | WLGS | NVDA | AAPL |
|---|---|---|---|
| Float | ~5M shares | ~2.4B shares | ~15.6B shares |
| Market Cap | ~$18M | ~$3T | ~$3T |
| Average Daily Volume | ~200K–1M | ~50M+ | ~70M+ |
| Volatility (1-Day) | +65% possible | ±2–3% | ±1–2% |
| Risk Profile | 🚨 High | Moderate | Low to Moderate |
So why does this matter? Because WLGS is built for fast trades, not long-term holds. You don’t need weeks or months of analysis — you need to catch the breakout window. And when alerts like WLGS hit with volume, you better be ready.
For deeper comparisons, see our analysis: Stocks vs. Gold for Long-Term Investing.
🔍 The Setup: Chart, Float, and What Sparked the Move
Big moves come from small floats — and WLGS had both the structure and the setup ready to explode.
⚙️ Low Float = Big Moves
WLGS has a public float estimated to be under 5 million shares, making it ultra-sensitive to volume. Any sudden buying pressure — especially early in the session — can trigger outsized spikes due to the limited supply of tradable shares.
Low-float stocks aren’t always predictable, but when paired with technical levels and real catalysts, they can move fast and hard.
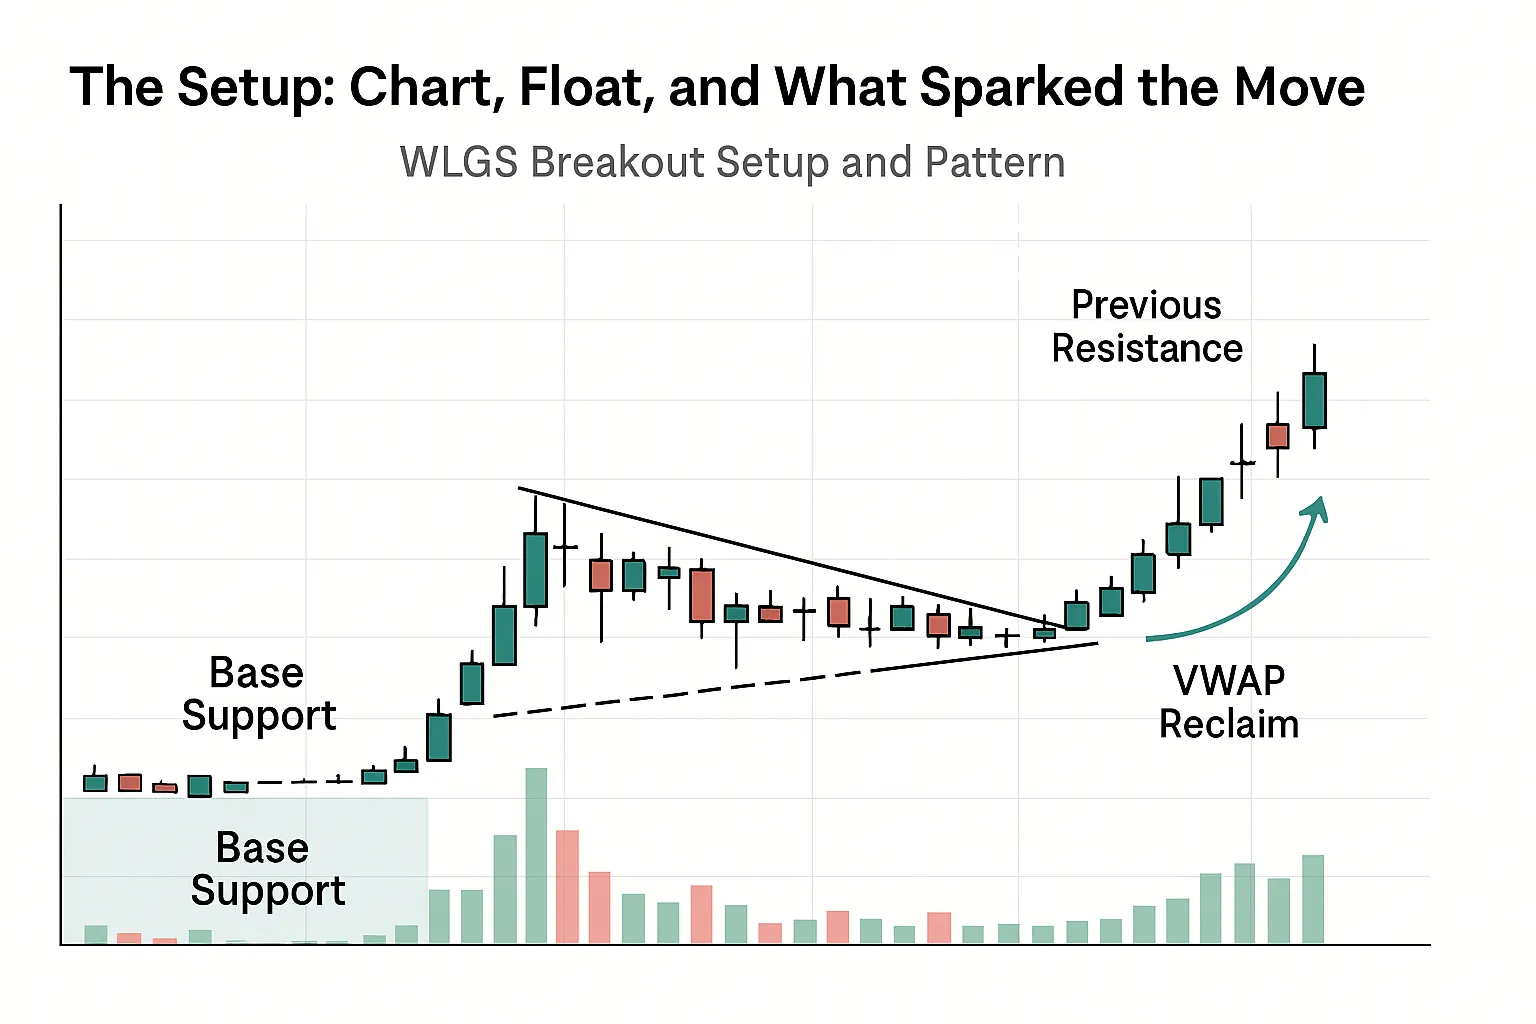
📈 Technical Levels: Why the Chart Mattered
We had WLGS on our watchlist from the $1.00–$1.10 support zone. The stock had bounced off this base multiple times throughout July. On July 22, it began pushing upward with increasing volume and held VWAP cleanly into close.
Early signs of a coil breakout were visible in the 5-min and daily charts. By premarket on July 23, volume had already doubled relative to the day before — a huge signal.
- Support: $1.05 zone (held on multiple tests)
- Resistance: $1.30 (was cracked intraday)
- VWAP reclaim: Pre-market July 23
Volume surged above average right at the open. Combine that with a float under 5M and you get what we saw — a clean, tradable breakout.
📰 The Catalyst (Subtle, But Important)
Unlike some pumpy penny plays, WLGS didn’t spike on a huge PR. It moved on a combination of:
- 💬 Increased mentions on Fintwit and low-float scanners
- 📊 Momentum triggers hitting scanners like Trade Ideas
- 📉 Short interest data showing over 30% of float was short
These pieces together didn’t scream news hype — they signaled momentum-based breakout potential. And for those watching premarket tape and volume patterns, the alert was obvious.
Want to learn how to spot these catalysts before they spike? Read Best Indicator for Swing Trading for tools we used to track this live.
🎯 Entry, Exit, and Managing the WLGS Trade
Calling a breakout is one thing. Executing with discipline is another.
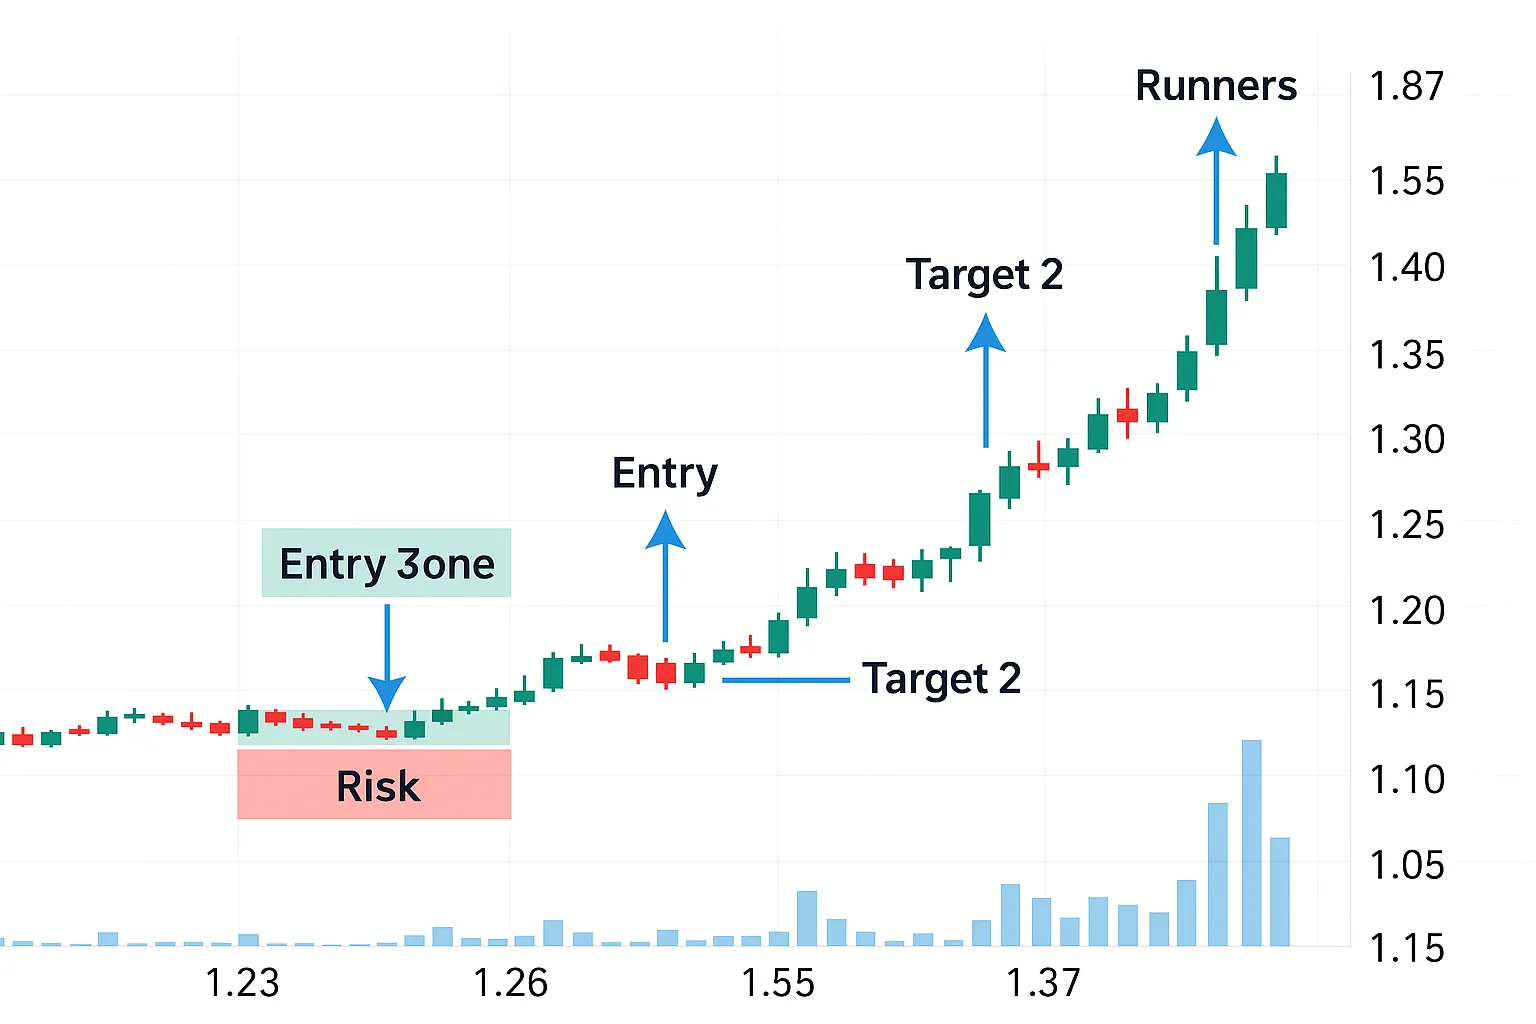
We alerted WLGS just after the premarket VWAP reclaim and volume spike through $1.20. The alert was issued to subscribers via text and platform notification at 1.23–1.26 zone, noting that a break over $1.30 could open up momentum.
📥 Entry Strategy
- Entry Zone: $1.23–$1.26 (early breakout trigger)
- Risk: Below $1.15 support with a $0.10 mental stop
- Float Factor: Microfloat with momentum = act fast
The stock broke $1.30 cleanly on high volume. Our alert noted this was a key resistance break and to scale partial profits at $1.40–$1.50.
📤 Exit Targets and Scaling Out
This wasn’t a “ride it and hope” situation. It was structured from the start:
- Target 1: $1.40 (20% gain)
- Target 2: $1.55 (scaling with strength)
- Final Push Zone: $1.70–$1.87 for runners
Most traders exited 80% of their position by the time WLGS hit $1.55, and held small runners with a stop above breakeven.
🧩 Trade Pros and Cons
| ✅ Pros | ❌ Cons |
|---|---|
| ✔ Tight entry-to-stop risk zone | ✘ Volatile low-float behavior |
| ✔ Volume confirmed the breakout early | ✘ Required fast execution |
| ✔ Resistance level was clean and known | ✘ No hard news catalyst (momentum only) |
For more on how we scale out trades like WLGS, check out Swing Trading Methods That Work.
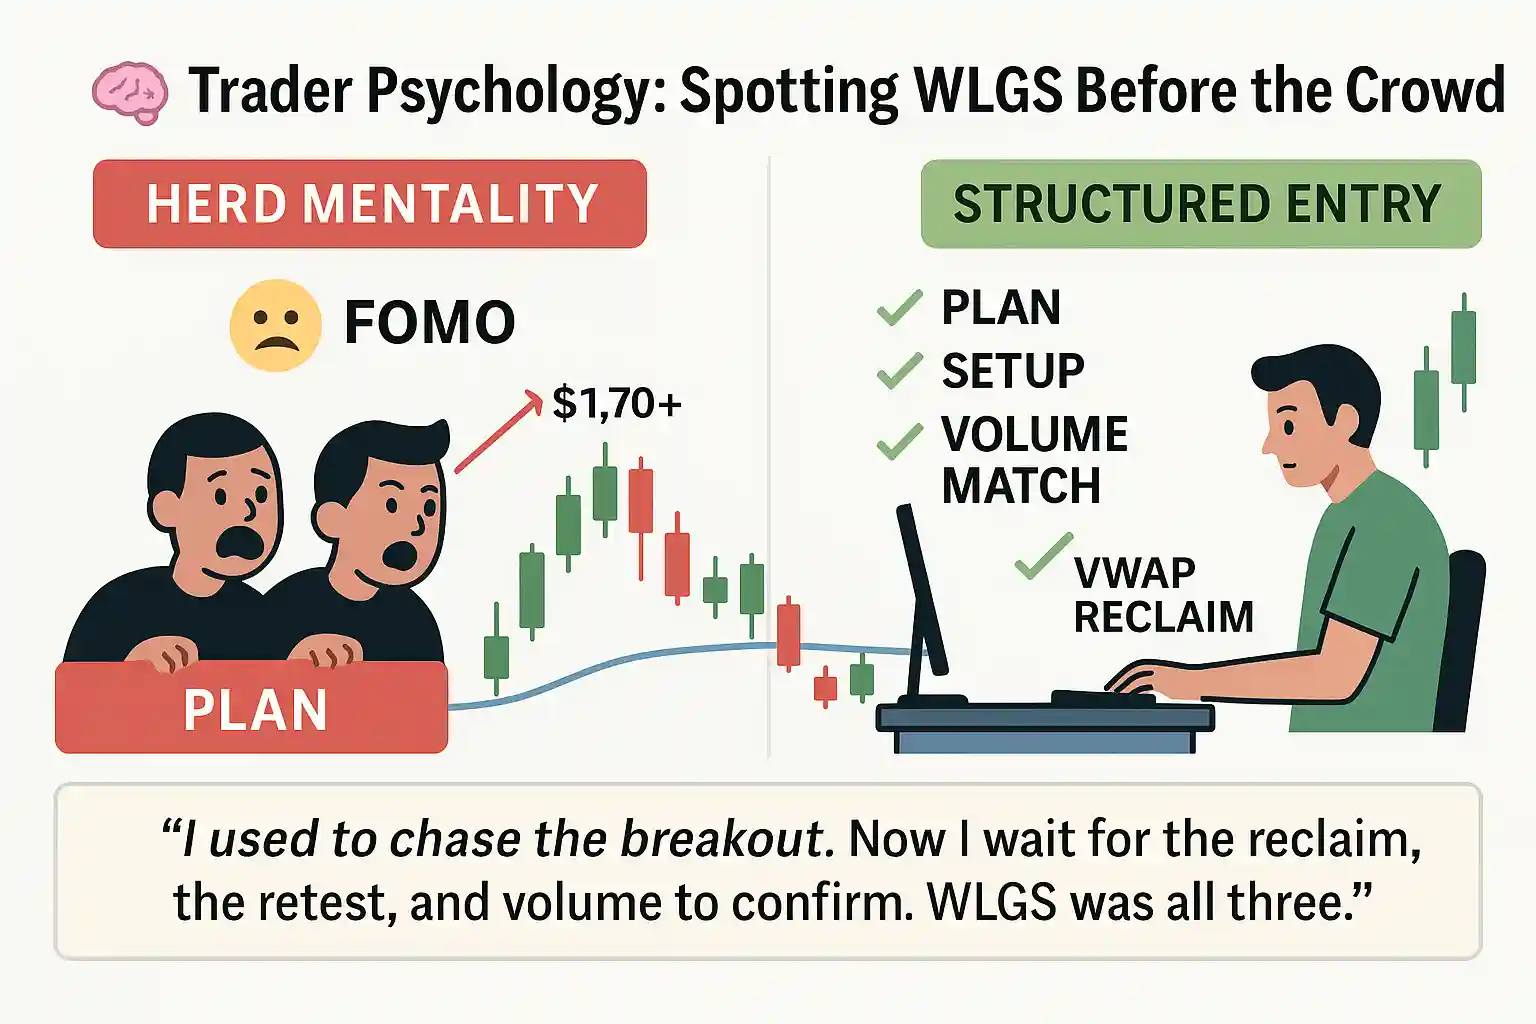
🧠 Trader Psychology: Spotting WLGS Before the Crowd
Most traders saw WLGS after it moved. We saw it before it mattered.
And this is where discipline separates skilled traders from the herd. Catching a breakout is not luck — it’s pattern recognition + volume timing + risk strategy.
👀 Why Most Traders Missed It
- They didn’t know WLGS was a low float.
- They ignored the tape action before the move.
- They hesitated when it broke resistance and paid the price chasing.
By the time WLGS hit the scanners, it was already running. Many tried to buy the top. We planned our trade before it hit the crowd.
🔎 How We Spotted It First
Here’s what we saw:
- Volume pressure building in the base
- Support holding three sessions in a row
- Coiling wedge into known resistance
- Relative strength compared to other low floats that morning
Most importantly, we weren’t trading based on emotion. We were reacting to structure.
“I used to chase the breakout. Now I wait for the reclaim, the retest, and volume to confirm. WLGS was all three.”
— Subscriber from Miami, FL
🧠 The Trading Mindset That Wins
The goal is never to catch the top. The goal is to catch the structured part of the move — the clean window between breakout and momentum exhaustion.
We don’t trade hype. We trade setup + volume + risk clarity. That’s what WLGS delivered, and why it made the cut for Trade of the Week.
Want to sharpen your psychology? Start with How AI is Reshaping the Stock Market — and why smart alerts filter noise.
✅ Key Takeaways from the WLGS Trade
Every great trade teaches something. WLGS taught a few things at once.
It wasn’t luck. It wasn’t news hype. WLGS was a clean technical setup backed by volume, structure, and low float mechanics.
📌 What Made This Trade Work
- Low float with active volume = high breakout potential
- VWAP reclaim early in the session
- Breakout over known resistance triggered buyers
- Risk was clearly defined with a tight stop zone
It’s the kind of trade we aim for — repeatable, strategic, and measurable.
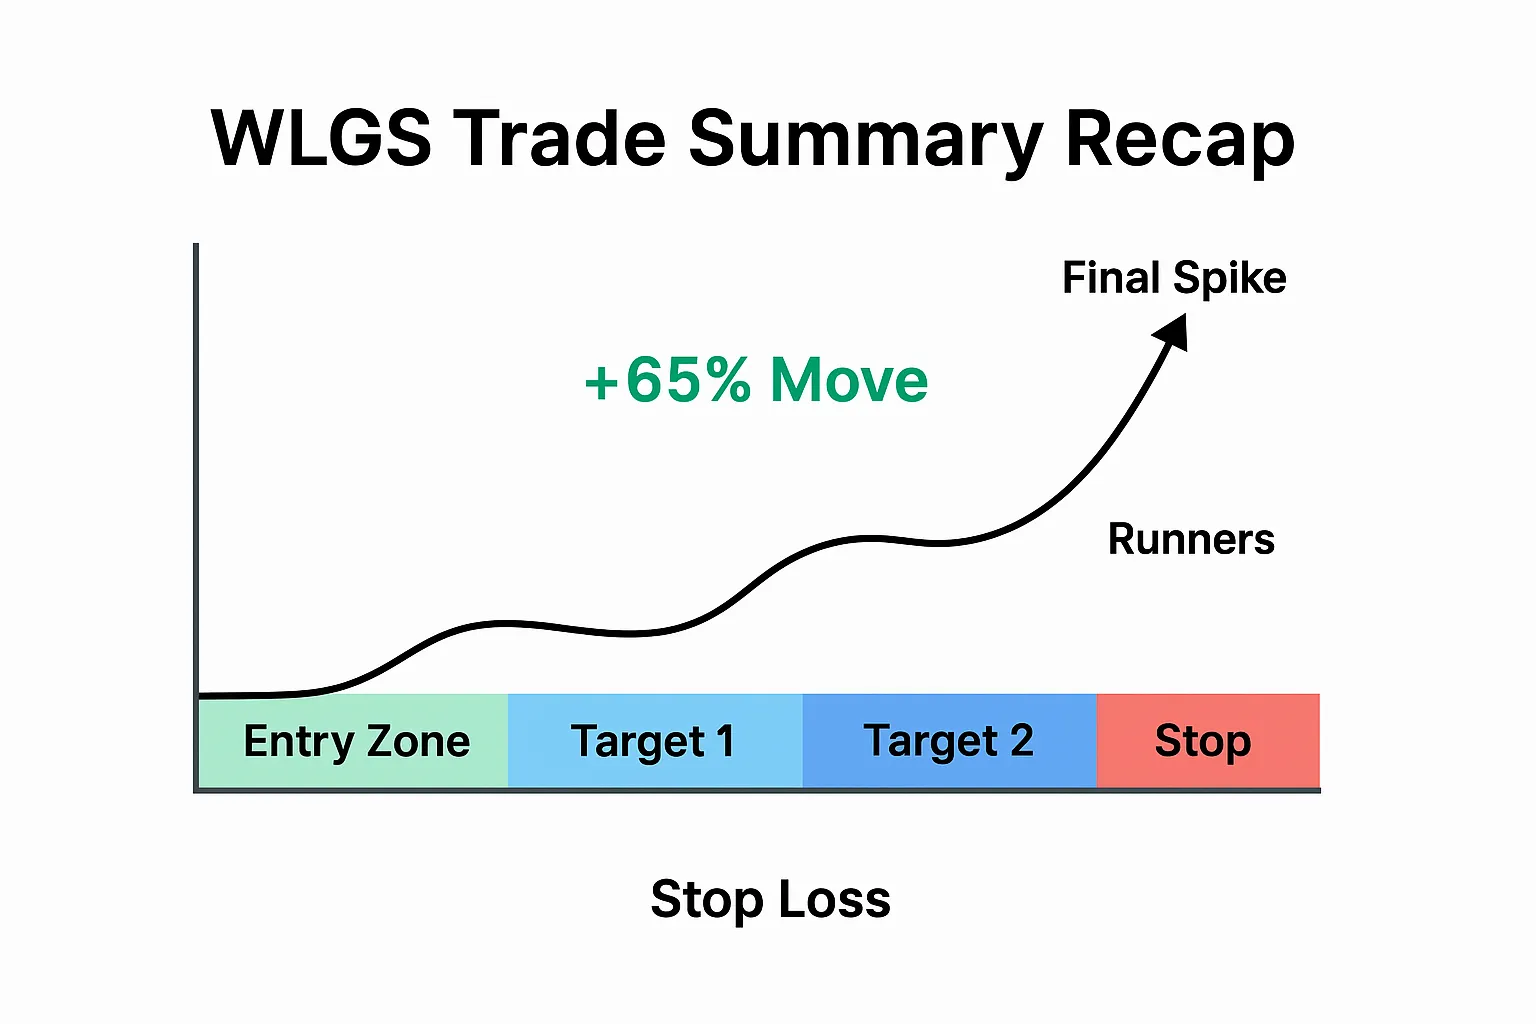
📊 WLGS Trade Recap Table
| Factor | Details |
|---|---|
| Entry Zone | $1.23–$1.26 |
| Stop Loss | Below $1.15 |
| Target 1 | $1.40 |
| Target 2 | $1.55 |
| Final Spike | $1.87 |
| Total Move | +65% |
Want more trades like this one? Browse our Daily Stock Picks for consistent alert opportunities.
Also worth checking: Benzinga’s guide on best penny stocks for broader sector moves.
❓ Frequently Asked Questions (FAQs)
1. Was WLGS on your premarket watchlist?
Yes — WLGS was highlighted for its low float and volume pressure. It was on our radar before the breakout happened.
2. Did you alert WLGS before the breakout?
Yes. We alerted it to premium members after the VWAP reclaim around $1.23. The alert included exact entry and stop zones.
3. Do you trade penny stocks regularly?
We trade based on setups — not hype. If a penny stock shows structure, float, and momentum, we’ll take the trade. If not, we don’t force it.
4. How do you manage risk in these fast moves?
We always define stops before entering. In this trade, the risk was less than $0.10 per share. We scale out along the way and trail smart.
5. How do I get these alerts in real time?
Subscribe here to get premarket alerts like WLGS before the breakout.
📚 Related Reading
- How to Build Discipline and Avoid Overtrading
- Top Penny Stocks Watch List
- Stocks vs. Gold for Long-Term Investing
- How I Grew a $1,000 Account to $10,000
- What Is Shorting in Day Trading?
🌐 External Resources
What Is a Penny Stock? – Investopedia
Get a foundational understanding of penny stocks and why they’re so volatile.
Best Penny Stocks – Benzinga
Updated list of hot penny stocks with market performance and volume surges.
Motley Fool: Penny Stock Investing Guide
Understand the pros, cons, and psychology behind investing in penny stocks.
WLGS Chart on TradingView
Track WLGS technicals live with TradingView tools and community analysis.
WLGS Snapshot – Finviz
See float, volume, financials and real-time charting for WLGS stock.
💬 Final Word: Want the Next WLGS?
Our alerts aren’t hype — they’re structured setups with real results. If you’re tired of chasing the move and want to start planning trades, not reacting, it’s time to subscribe.