Continuation Patterns
Suggest the trend will resume after a pause. Example: a bullish pennant during an uptrend often precedes another leg higher.
Charts don’t just show prices—they reveal market psychology in motion. When you recognize reliable price patterns, you gain a measurable edge: clear entries, disciplined exits, and smarter risk management.
“Price patterns are the footprints of crowd behavior—learn to read them, and you’ll anticipate the next step.”
Markets trend, pause, reverse, and trend again. Those transitions leave repeatable shapes on candlestick charts—pennants, flags, wedges, cup & handle, and head & shoulders. When combined with volume confirmation, these patterns can signal higher-probability moves and help you plan stop-loss and take-profit levels like a pro.
Suggest the trend will resume after a pause. Example: a bullish pennant during an uptrend often precedes another leg higher.
Hint that momentum is changing direction. Example: a completed head & shoulders top can foreshadow a deeper pullback.
Investopedia — foundational concepts, trend, support/resistance, and indicators.
Read more →TradingView — community ideas and educational posts on real charts.
Explore ideas →External links balanced to support SEO: one dofollow and one nofollow. More cards appear in later blocks.
Want a primer before we dive in? Brush up on the fundamentals of stock investing, then compare day vs. swing trading to match a strategy to your schedule and risk tolerance.
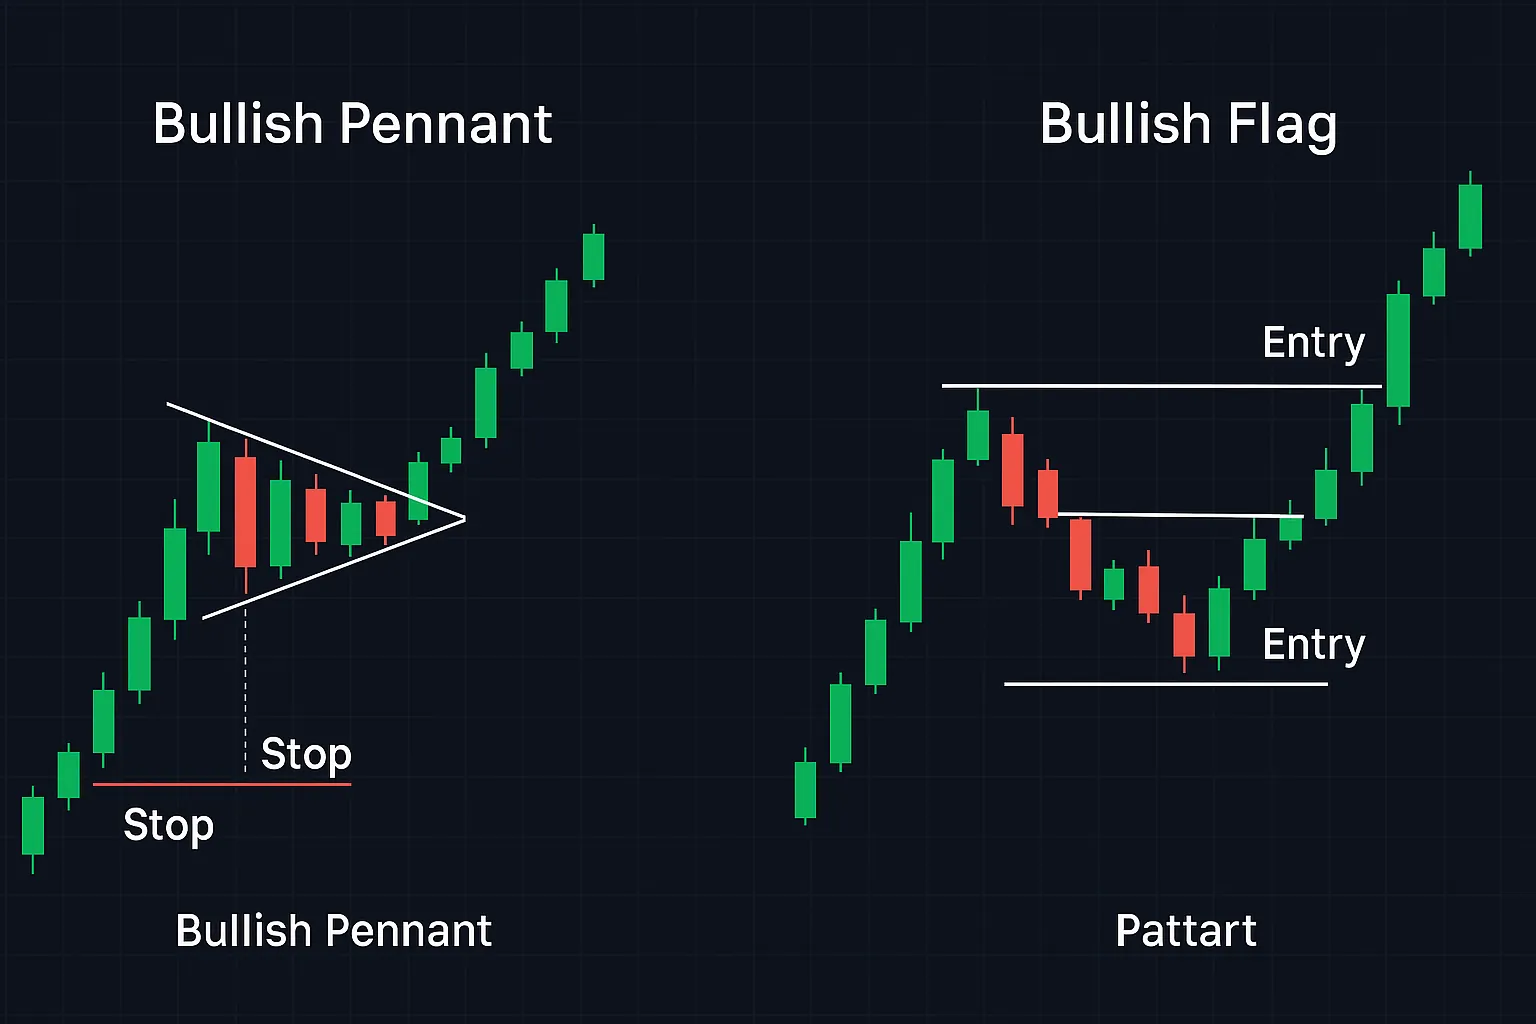
Pennants and flags are among the most reliable continuation patterns in technical analysis. They typically occur after a sharp price movement, when the market pauses before resuming in the same direction. By identifying them early, traders can enter just before the next impulse move, potentially capturing significant gains.
“Momentum loves company — when the crowd pauses but doesn’t sell, the next move can be explosive.”
Want to pair pennant recognition with the right indicators? Check our guide on the best swing trading indicators.
| ✅ Pros | ❌ Cons |
|---|---|
| High reliability when confirmed by volume | False breakouts possible in low-liquidity stocks |
| Works on multiple timeframes | Can be short-lived, requiring fast reaction |
| Clear stop-loss and target levels | May fail in choppy, news-driven markets |
In Q2 2024, XYZ Corp surged 15% after a better-than-expected earnings report. Over the next three days, the stock formed a tight pennant with declining volume. Once price broke above the upper trendline on high volume, traders who entered saw an additional 8% gain within two sessions.
This move mirrored patterns we regularly monitor in our Daily Stock Picks feed — proving how pattern awareness can lead to repeatable setups.
A wedge pattern is a powerful chart formation where price action narrows over time, signaling a potential breakout. Wedges can forecast both reversals and continuations depending on the trend context. By studying the slope, volume, and breakout direction, traders can anticipate high-probability setups.
“When price is coiling tighter inside a wedge, it’s like a spring — once it uncoils, it can travel far.”
For pattern integration with your strategy, see our swing trading setups and technique breakdowns.
In 2024, shares of DEF Inc. trended down 20% over two months, then began forming a falling wedge. Volume contracted steadily, and on the breakout day, price gapped above the wedge with a 35% volume increase. Traders entering at the breakout captured a 12% gain in just one week.
These setups appear frequently in our daily stock picks watchlist.
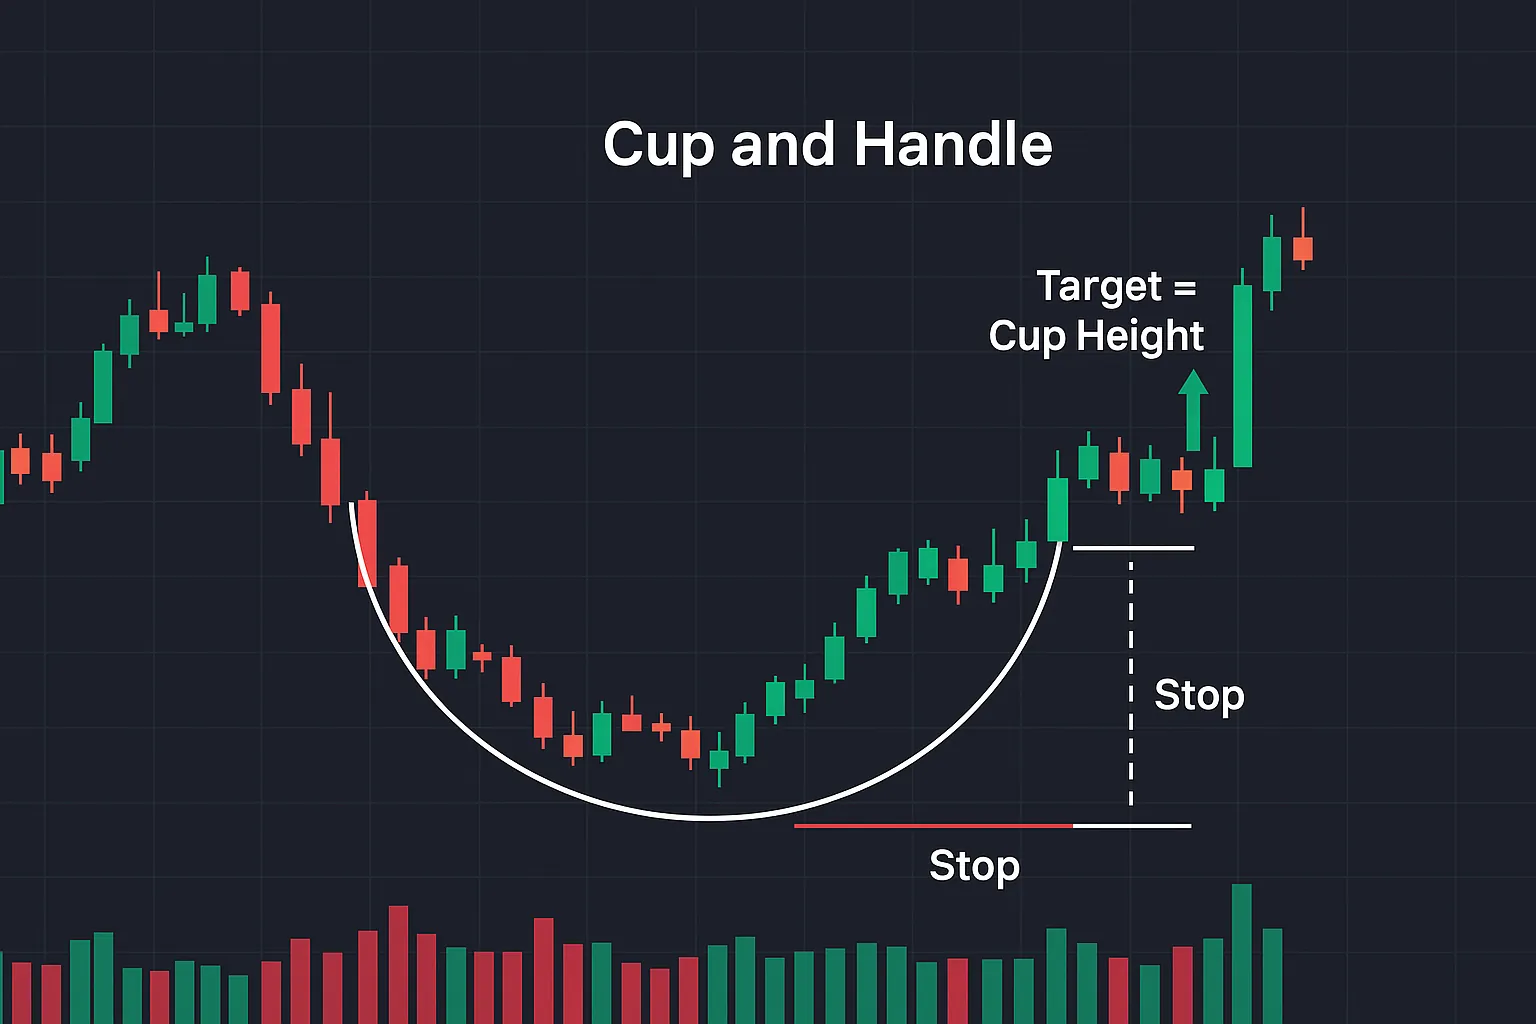
The cup & handle is a time-tested continuation (and sometimes reversal) pattern that signals institutional accumulation followed by a shallow pullback before an attempted breakout. Executed well, it provides clear entries, logical stops, and measured targets—ideal for both stock and options traders.
For a fundamentals refresher before applying this pattern, review the core investing principles:contentReference[oaicite:0]{index=0}, then align timeframe with your style in day vs. swing trading:contentReference[oaicite:1]{index=1}.
Prefer curated opportunities? Scan our daily stock picks:contentReference[oaicite:2]{index=2} and pattern-focused swing alerts:contentReference[oaicite:3]{index=3}.
Over eight weeks, QRS Tech formed a rounded cup of ~18% depth, then built a 5-day handle drifting lower on light volume. Two days before earnings, price broke above the handle high on a volume surge. Traders entered at breakout, set stops just beneath the handle low, and targeted the projected cup height. The first target (1R) hit within three sessions, with runners trailed under higher lows into the report. Post-earnings, the measured-move target completed.
If you’re allocating capital around base breakouts, revisit our primer on building a diversified portfolio:contentReference[oaicite:4]{index=4}.
This block’s card is nofollow. Dofollow cards appear in other blocks to preserve a 50/50 outbound mix.
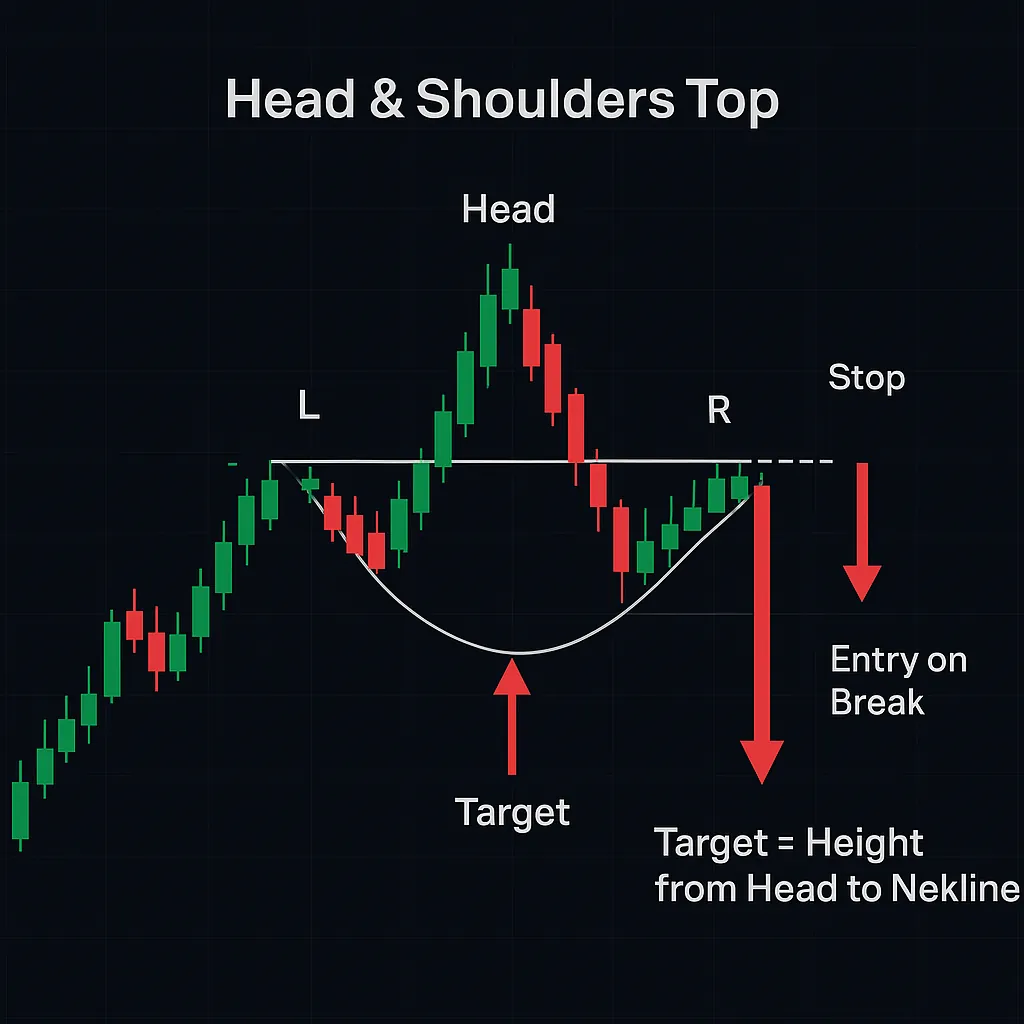
The head & shoulders (H&S) is one of the most respected reversal patterns. It often appears after a prolonged trend, signaling a shift in control between buyers and sellers. The core idea is simple: a neckline underpins price; once it breaks (with volume confirmation), probability skews toward a trend change.
If you’re newer to pattern structure or want a primer to share with teammates, keep a copy of our beginner-friendly PDF:contentReference[oaicite:0]{index=0} handy.
Want a room to sanity-check live breakouts? Join the Swing Trading Chat Room:contentReference[oaicite:1]{index=1} or get structured guidance from a Day Trading Mentor:contentReference[oaicite:2]{index=2}.
After a multi-month uptrend, Omega Semi carved a textbook H&S top on the daily chart: a strong head, a lower right shoulder, and a flat neckline. On a sector-rotation day, price closed below the neckline with a notable volume surge. Short entries triggered on the close; stops placed above the right-shoulder high. The measured move (head-to-neckline height) projected a 9% target, which price reached within eight trading sessions. A staged exit (50% at 1R, remainder near target) locked gains and reduced overnight risk.
Prefer smaller, faster names? Apply the same rules to liquid tickers identified via our Penny Stock Alerts:contentReference[oaicite:4]{index=4} feed.
External links remain balanced across the article. This card is dofollow.
Even the best chart patterns fail without the right mindset, discipline, and trade management. In this section, we’ll combine real-world examples with professional perspectives so you can better understand not just what to trade, but how to think and act while trading.
In early 2025, XYZ Semi broke out of a bullish pennant identified on our Daily Stock Picks:contentReference[oaicite:0]{index=0} list. The pattern formed after a 12% rally on earnings. Price consolidated for five sessions, volume contracted, then exploded higher on a breakout day. Entry was taken above the pennant high, with stops inside the pattern. Within a week, price reached the measured move target for an 8% gain.
Alpha Energy had been in a downtrend for two months before forming a falling wedge on the daily chart. The setup was discussed in our Swing Trading Success Stories:contentReference[oaicite:1]{index=1} series. The breakout above the upper trendline coincided with sector rotation into energy, fueling a 15% rally in 10 sessions. Traders scaled out at predefined targets, locking in gains.
For a deeper dive into integrating psychology with strategy, check our guide on long-term smart investing:contentReference[oaicite:2]{index=2}.
This card is nofollow. The balance with dofollow links is maintained across the article.
Reliability depends on trend context, volume confirmation, and market liquidity. Many traders favor cup & handle and flags/pennants during strong uptrends, while head & shoulders is respected as a reversal signal. Improve odds by confirming with volume behavior:contentReference[oaicite:0]{index=0} and sticking to liquid names.
Aggressive traders enter on the closing break. Conservative traders wait for a retest of the broken level with supportive volume. Backtest both approaches and use the one that matches your temperament and rules from our beginner training:contentReference[oaicite:1]{index=1}.
Yes—patterns are timeframe-agnostic. For intraday traders, confirm on higher timeframes first, then refine entries on lower intervals. Compare approaches in day vs. swing trading:contentReference[oaicite:2]{index=2}.
Place the stop where the pattern is invalidated (e.g., below the handle low, outside a wedge boundary, or above a right shoulder). Then size so a loss equals a fixed % of equity (e.g., 0.5–1.0%). Need a primer? See fundamentals of stock investing:contentReference[oaicite:3]{index=3}.
Use volume filters, trade only liquid tickers, and favor breakouts aligned with catalysts. If stopped out, log the trade and move on. Consider scanning curated ideas in our daily stock picks:contentReference[oaicite:4]{index=4}.
Absolutely. News shocks and liquidity vacuums can invalidate A+ setups. Always use stops, stage exits, and keep position sizes modest. For live guidance and accountability, consider our swing trading alerts:contentReference[oaicite:5]{index=5} or day trading alerts:contentReference[oaicite:6]{index=6}.
Combine focused study with reps: review 50–100 historical examples of each pattern and simulate trades. Start with the essentials in our beginner PDF:contentReference[oaicite:7]{index=7} and practice with swing trading methods:contentReference[oaicite:8]{index=8}.
Ready to put this playbook to work? Get curated setups via Swing Trading Alerts:contentReference[oaicite:9]{index=9}, quick opportunities with Day Trading Alerts:contentReference[oaicite:10]{index=10}, and a daily watchlist at Daily Stock Picks:contentReference[oaicite:11]{index=11}.