Why False Signals Are a Trader’s Worst Enemy
Spot them fast, protect your capital, and trade with conviction.
What Is a False Signal?
A false signal is a technical or fundamental cue that appears to confirm a trade setup but fails to follow through. Think of a “breakout” that immediately reverses, or bullish news that’s already priced in. The danger isn’t just the losing trade — it’s the confidence erosion that follows, often leading to revenge trades and overexposure.
Your risk exposure to false signals also depends on your approach. If you’re deciding between faster entries and confirmation-based holds, compare day trading vs swing trading to align your strategy with signal reliability:contentReference[oaicite:0]{index=0}. For cutting through noisy headlines and hype, use our practical framework here: cut down on market news noise:contentReference[oaicite:1]{index=1}.
Why Traders Keep Falling For False Signals
- FOMO & urgency: Fast candles and social buzz trigger impulsive entries.
- Confirmation bias: We favor data that supports our thesis and ignore contrary evidence.
- Indicator overreliance: A single indicator (RSI/MACD) without context invites traps.
- Low-liquidity mirages: Thin order books can create fake breakouts or breakdowns.
Red Flags to Treat With Skepticism
- Breakouts without volume: Price pierces resistance, but volume is average or falling.
- News-driven spikes that fade on the next candle — often a liquidity hunt.
- Divergences (e.g., higher highs in price, lower highs in momentum) that aren’t confirmed by breadth or volume.
- Pre-market gaps that fill immediately after the open without fresh catalysts.
- One-indicator signals used in isolation, especially on lower time frames.
Pros & Cons of Acting on Early Signals
- Early entries with tight stops can capture big moves.
- Helps build pattern recognition when paired with journaling.
- Can improve risk-reward if quickly invalidated.
- Higher chance of whipsaw in choppy markets.
- Encourages overtrading if not rule-based.
- Can create a loss spiral without strict risk control.
“Patience turns confusing noise into clear signals.” — Veteran Quant Trader
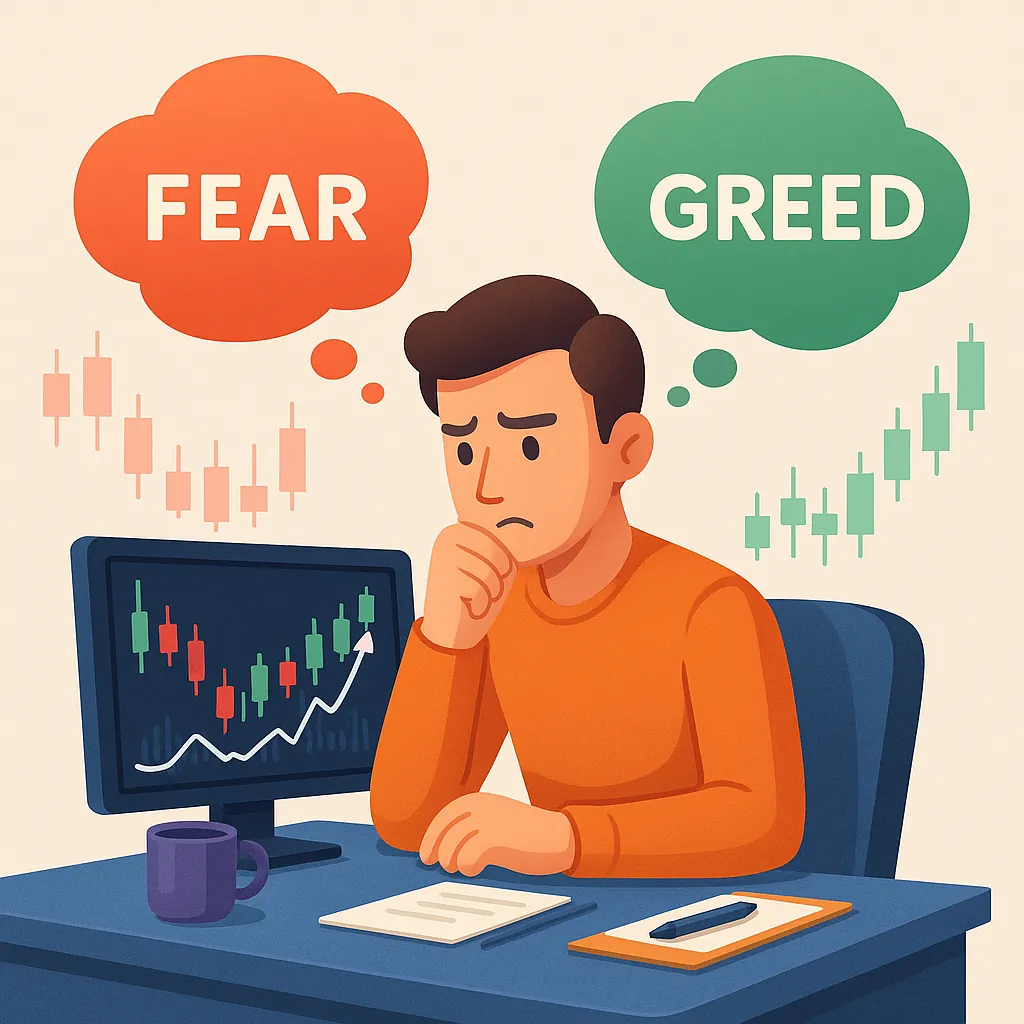
The Psychology Behind Falling for False Signals
Understanding the mind traps that make traders vulnerable.
Even the best trading strategy can fail when psychology gets in the way. False signals often succeed because they prey on deep-rooted cognitive biases and emotional triggers. Recognizing these mental pitfalls is just as important as reading a chart. Without this awareness, traders can fall into repetitive cycles of loss — not because the market is unbeatable, but because their decision-making process has been compromised.
— Dr. Elaine Rogers, Behavioral Economist
The temptation to act on a signal without full verification is amplified by human bias. Learn how to identify bad stock news before it influences your trades:contentReference[oaicite:0]{index=0}.
Main Cognitive Biases Behind False Signal Decisions
- Confirmation Bias: Seeking out information that supports your existing trade idea while ignoring red flags.
- Recency Effect: Giving undue weight to recent wins or trends, assuming they will continue.
- Anchoring: Fixating on a specific price level or indicator value and failing to adapt when conditions change.
- Overconfidence: Believing your read on the market is immune to error, leading to larger position sizes.
- Loss Aversion: Holding onto a losing trade longer than necessary because you don’t want to admit the signal failed.
Case Example: The FOMO Breakout Trap
In March 2023, a swing trader spotted a sharp pre-market breakout in a mid-cap tech stock. Ignoring the low volume and lack of fresh news, they entered aggressively at the open. Within 15 minutes, the stock reversed, hitting their stop-loss and turning a potential 5% gain into a 3% loss. The root cause wasn’t the setup — it was FOMO overriding patience and due diligence.
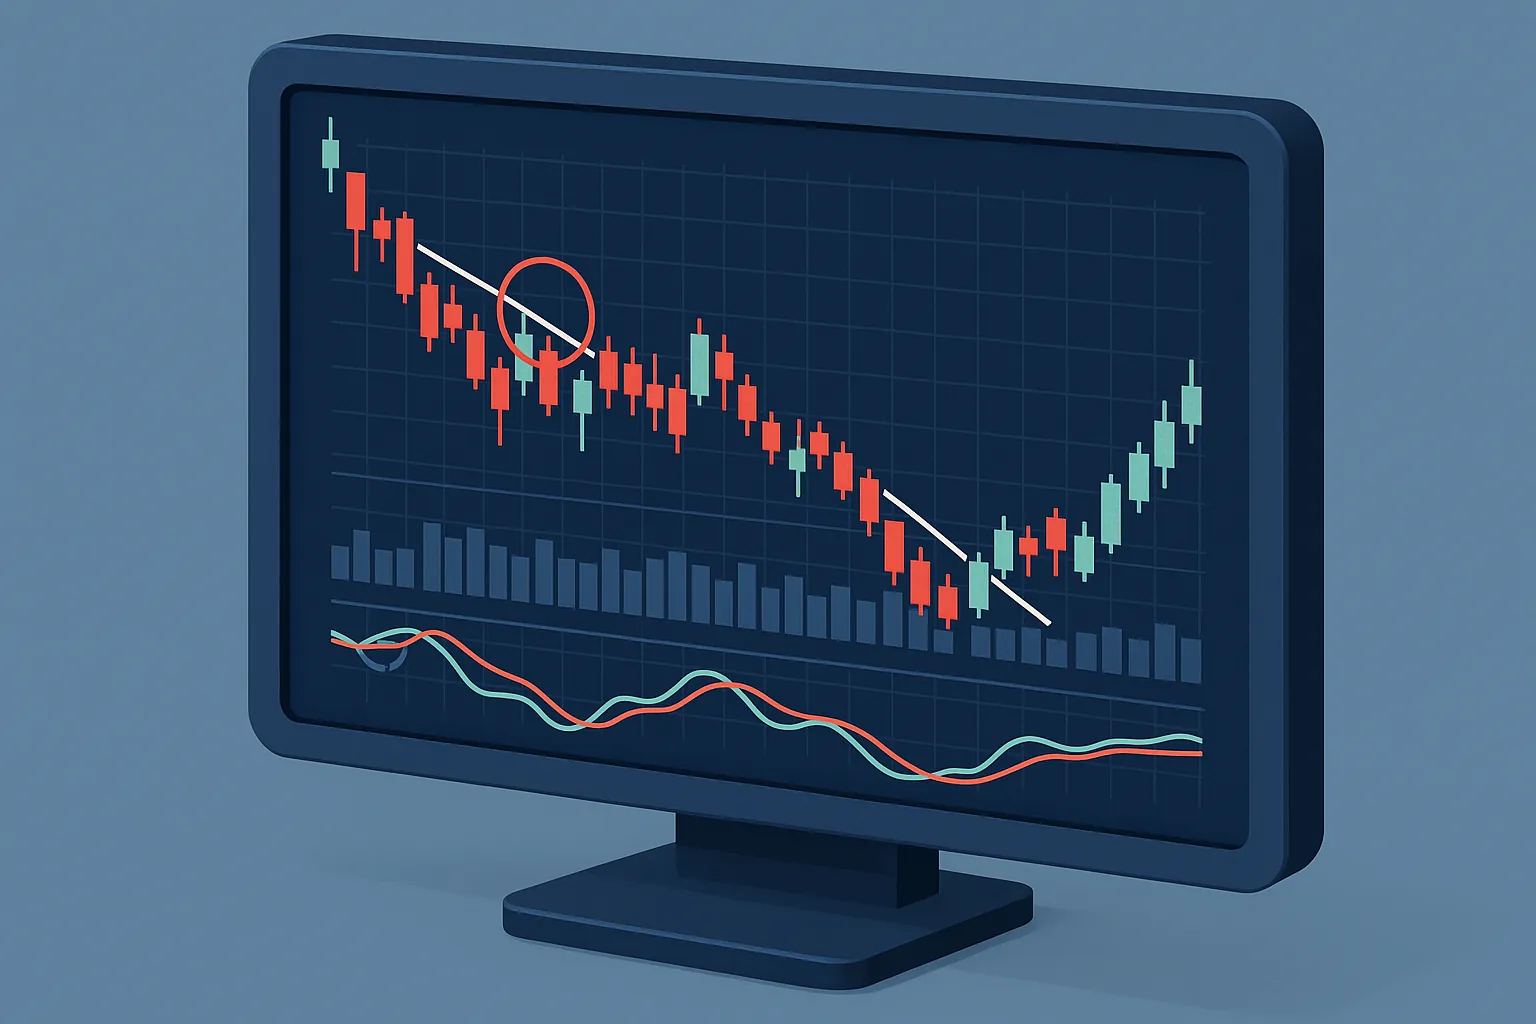
The Essential Checklist: Technical Red Flags
Spot unreliable setups before they sabotage your trades.
Technical analysis is a powerful tool — but it’s not infallible. Many traders place too much trust in chart patterns, indicators, or price action cues without considering the context. Below is a detailed checklist of technical red flags that often signal a setup is weaker than it looks.
For more insights on building a reliable strategy, see our guide on the best indicator for swing trading :contentReference[oaicite:0]{index=0}.
Technical Signals That Demand Extra Caution
- Overextended RSI above 80 — Indicates a potential overbought trap rather than sustained momentum.
- Sudden volume spikes without news — Could be algorithmic activity or market makers hunting stops.
- Divergence between price and MACD/RSI — Price moving up while momentum slows is a warning sign.
- Breakouts on low volume — Often fail to follow through due to lack of buying pressure.
- Pre-market gaps that close quickly — Indicates weak conviction from institutional players.
Pros & Cons of Technical Analysis Tools
| Technical Tool | Pros | Cons |
|---|---|---|
| RSI | Simple to read, great for overbought/oversold signals | May produce premature reversal alerts |
| MACD | Effective for spotting trend changes | Lagging; may miss the early move |
| Volume Analysis | Confirms price action validity | Context-dependent; misleading in thinly traded stocks |
“A chart without context is just noise — context turns it into a signal.” — Elena Cruz, Market Analyst
The Essential Checklist: Fundamental Red Flags
Looking beyond the charts to spot deceptive market signals.
Technical analysis shows what’s happening; fundamentals explain why. Ignoring fundamentals can leave traders vulnerable to false signals disguised as legitimate moves. The following checklist will help you uncover the hidden weaknesses in a stock’s core data before you risk capital.
To deepen your understanding of how trading volume and price interplay, see our guide on how a stock’s volume can affect its price :contentReference[oaicite:0]{index=0}.

Fundamental Warning Signs That Can Mislead Traders
- Overly optimistic earnings guidance without matching revenue trends.
- Sudden accounting changes or restatements in SEC filings.
- One-time revenue boosts masking declining core business performance.
- High debt-to-equity ratio with no clear repayment strategy.
- Management selling large shares right before earnings releases.
Case Example: Inflated Earnings Mirage
In late 2022, a mid-cap retail company reported a surprising earnings beat. Investors rushed in, pushing shares up 12% overnight. A deeper look at the company’s 10-Q filing revealed that most revenue came from one-time asset sales, not ongoing operations. The next quarter, when these sales didn’t repeat, earnings collapsed, and the stock gave up all gains within days.
Pros & Cons of Fundamental Analysis
- Provides insight into long-term viability of a company.
- Helps filter out hype-driven price moves.
- Essential for evaluating value vs. growth potential.
- Time-consuming and requires deep research skills.
- May lag behind rapid market sentiment shifts.
- Can be distorted by creative accounting practices.
“Great charts may lie, but fundamentals rarely do.” — Simon Lee, Equity Research Analyst
Case Studies: Real-Life False Signal Disasters
When the market sends the wrong message — and traders pay the price.
Real-world examples provide the most powerful lessons. Below are three case studies where traders misread signals that appeared legitimate — only to watch trades turn against them. These stories show how technical traps, misleading fundamentals, and psychological bias can combine into costly mistakes.
For a proactive approach, our penny stock alerts:contentReference[oaicite:0]{index=0} service helps filter out weak setups before they become expensive errors.
Case Study 1: The Volume Mirage
In August 2023, a biotech stock surged pre-market on seemingly massive volume. Traders assumed institutional buying was driving the move. However, deeper analysis revealed that most trades were internal transfers between market makers, not genuine accumulation. By the market open, momentum fizzled, and the stock closed the day down 7%.
Case Study 2: The Earnings Beat Trap
A mid-cap retailer posted earnings per share 15% above estimates, triggering a rapid 10% intraday rally. Traders piled in, overlooking the fact that the beat was driven entirely by aggressive cost-cutting — not revenue growth. When guidance was cut the following quarter, the stock dropped 18% in two days.
Case Study 3: The Breakout That Wasn’t
A technology stock broke out of a six-month consolidation with strong bullish candles. The move looked textbook — until an unexpected SEC investigation was announced just hours later. The breakout reversed instantly, triggering stop-losses across retail accounts.
Lessons Learned From These Disasters
| Mistake | Impact | Prevention Strategy |
|---|---|---|
| Assuming all volume is bullish | Losses from fake accumulation | Verify trade sources and block size |
| Ignoring quality of earnings beat | Buying into unsustainable gains | Check revenue trends and forward guidance |
| Not scanning for pending news | Breakout reversal due to negative news | Always monitor SEC, PR, and news wires |
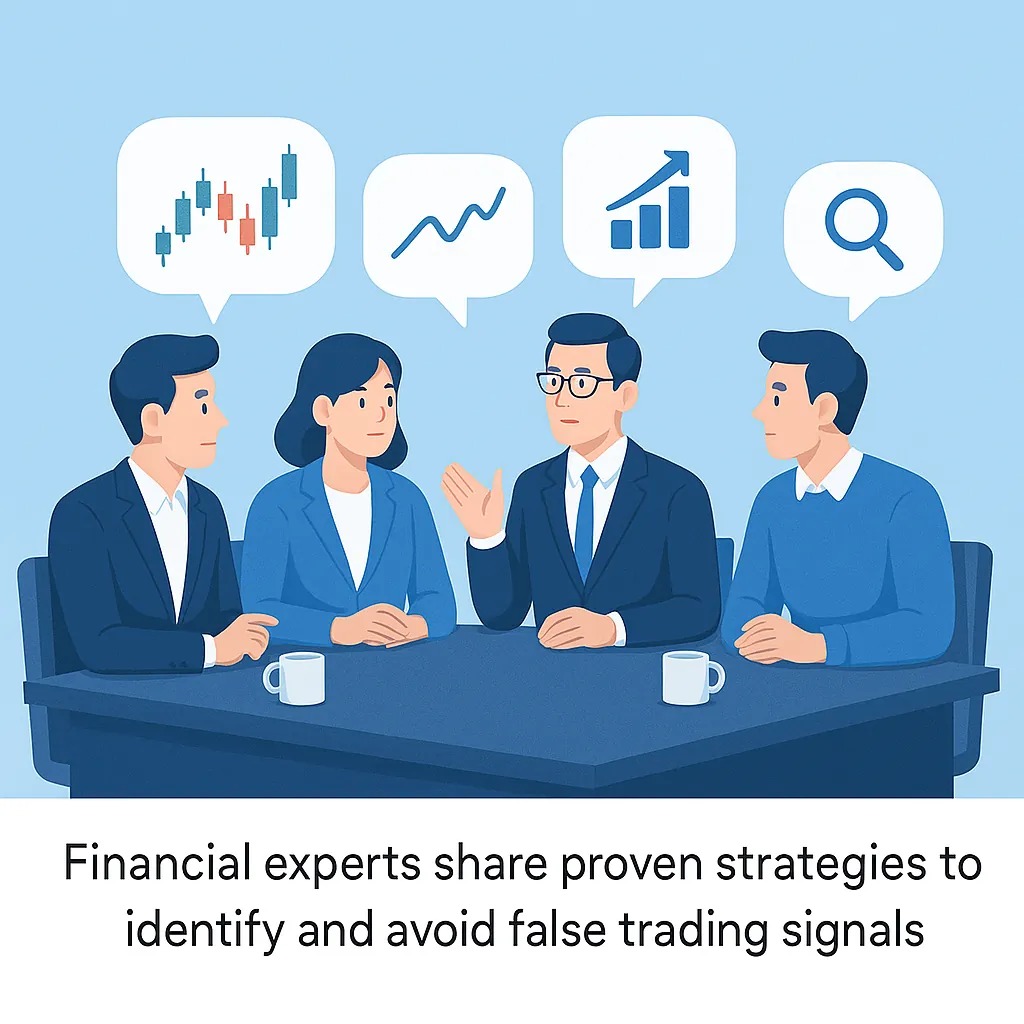
Expert Insights & Interviews
Seasoned traders reveal how they identify and avoid false market signals.
Learning from market veterans can shave years off your trading learning curve. These expert perspectives highlight the practical tools, risk management habits, and mental frameworks they use to sidestep false buy and sell signals that trap less experienced traders.
For more inspiration from those who’ve mastered the markets, explore our swing trading success stories :contentReference[oaicite:0]{index=0}.
Interview: James Harlow — Former Hedge Fund Manager
“The number one mistake I see retail traders make is reacting too quickly to early price movement. I wait for two layers of confirmation — volume expansion and sector alignment — before entering a trade. False signals thrive in isolation, so the more context you have, the stronger your edge.”
Interview: Sofia Ramirez — Technical Analyst
“I treat every breakout like it’s a trap until proven otherwise. My rule is simple: if the move can’t hold past the first 30 minutes, it’s suspect. This one habit alone has saved me from dozens of losing trades each year.”
Interview: Dr. Ken Yamada — Behavioral Finance Professor
“The most dangerous signals are the ones that confirm your existing bias. Traders need to actively seek disconfirming evidence before committing capital. Otherwise, you’re not analyzing — you’re just rationalizing.”
Expert Checklist for Spotting False Signals
| Expert | Top Tip | Why It Works |
|---|---|---|
| James Harlow | Wait for multi-layer confirmation | Reduces false positives from isolated price moves |
| Sofia Ramirez | 30-minute breakout hold rule | Filters out opening volatility traps |
| Dr. Ken Yamada | Actively seek disconfirming evidence | Prevents bias-driven decision making |
“The market doesn’t reward speed — it rewards accuracy.” — James Harlow
Your Action Plan + FAQ
Turn knowledge into action and avoid costly false signal mistakes.
Now that you understand the technical, fundamental, and psychological elements of false signals, it’s time to put that knowledge into a practical framework. This step-by-step action plan will help you systematically evaluate every trade setup so you can avoid traps and protect your capital.
For a beginner-friendly foundation, our Stock Market for Dummies PDF guide :contentReference[oaicite:0]{index=0} walks you through essential market concepts with clear examples.
Step-by-Step Plan to Avoid False Signals
- Start with market context — Assess the overall market trend before zooming into individual stocks.
- Use multi-layer confirmation — Combine at least one technical and one fundamental factor before entering a trade.
- Check volume patterns — Avoid trades with weak or inconsistent volume support.
- Scan for news & filings — Look for recent or pending events that could invalidate the setup.
- Set predefined risk limits — Decide your stop-loss level and position size before entering.
- Journal every trade — Track what worked, what didn’t, and why, so you can refine your process.
Frequently Asked Questions
1. What is the fastest way to spot a false signal?
Look for volume confirmation. If price moves strongly without a corresponding increase in volume, it’s often a trap.
2. Should I trust indicators over price action?
Neither should be trusted in isolation. The best approach is a confluence of factors — technical, fundamental, and sentiment-based.
3. How often do false signals occur?
They are common in volatile markets or during low liquidity periods. Awareness and patience are key to avoiding them.
4. Can false signals ever be profitable?
Occasionally, if managed with tight stops and a reversal strategy. However, they are generally high-risk and not recommended for beginners.
5. Do institutional traders also fall for false signals?
Yes — but they often have tools and resources to detect them faster, minimizing the damage.
“Patience is the filter through which false signals are revealed.” — Olivia Chen, Market Strategist
Recommended High-Authority Resources
A trusted financial education source for understanding technical and fundamental traps.
Stay informed with up-to-date coverage of stock market movements and analyst commentary.
Global financial data, analysis, and interviews with industry leaders.
How cognitive biases influence decision-making in markets and beyond.