Quick Summary: 7 Crucial Signs It’s Time to Sell a Stock Before It Tanks
Selling Right is a Superpower
Anyone can buy a stock. The real edge is knowing when to sell—before a minor dip becomes a major drawdown. In this guide, you’ll learn how top investors protect profits, avoid round-trips, and rotate capital into better opportunities with disciplined, repeatable rules.
“Your sell decision determines your ultimate return more than your buy decision.” — Mark Minervini
Why the Exit Matters as Much as the Entry
A stock is not just a ticker—it’s a living, breathing business. When the business reality changes, your position should too. If you treat shares as slices of a company, your sell rules become clearer and less emotional. For a quick refresher on why ownership mindset matters, see this primer on owning businesses via stocks:contentReference[oaicite:0]{index=0} and these fundamental investing basics:contentReference[oaicite:1]{index=1}.
Great investors also keep an eye on opportunity cost. Each dollar you leave in a lagging name could be compounding in a stronger trend. For ongoing ideas and results-focused recaps, bookmark Daily Stock Picks:contentReference[oaicite:2]{index=2}, and compare how disciplined exits can preserve gains over time.
Case Study: From +200% to Breakeven—A Painful Round-Trip
A growth investor rode a high-flyer from $20 to $60 without a plan to scale out. When earnings decelerated, the stock cracked its 50-day moving average, then its 200-day. Without predefined sell rules, the position round-tripped—turning a triple into breakeven. A simple rule—such as trimming into strength and selling on a decisive break of the 200-day with volume—could have banked life-changing gains.
- What went wrong: No exit plan, overconfidence in a narrative.
- The fix: Objective rules (trend lines, moving averages, earnings quality) + stop/alerts.
Pros
- ✅ Locks in gains before momentum breaks.
- ✅ Reduces stress and decision fatigue.
- ✅ Frees capital for higher-probability setups.
Cons
- ❌ Risk of selling too early before a secondary run.
- ❌ Potential tax implications on short-term gains.
- ❌ Requires consistent monitoring and rule discipline.
Expert Opinions
Market technicians often argue that price and volume confirm fundamentals faster than narratives. As one veteran trader put it, “Charts whisper before headlines shout.” For a structured overview of classic sell signals and methodology, this Investopedia primer is a solid starting point:
Sign #1 – Fundamentals Are Cracking
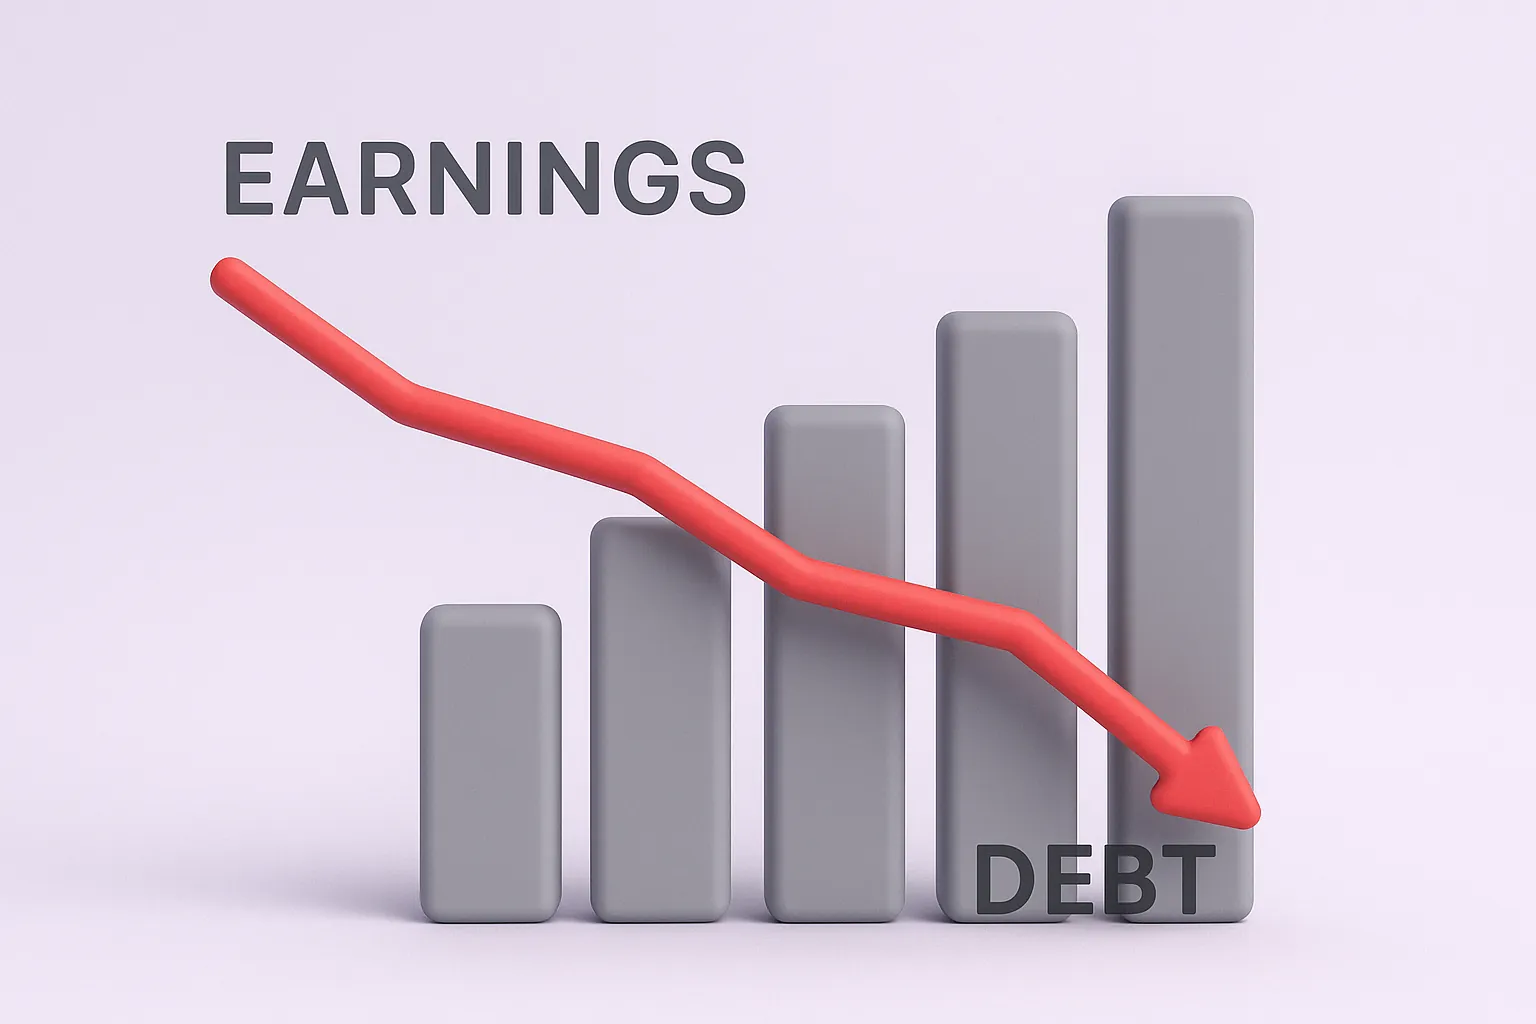
When the core financial health of a company begins to weaken—falling revenue, shrinking margins, rising debt—it’s often the earliest signal to sell. Numbers don’t lie: if earnings momentum slows while costs rise, the underlying business case for holding the stock erodes.
Case Study: Netflix Q2 2022 Earnings Miss
In Q2 2022, Netflix reported its first subscriber loss in over a decade. Revenue growth slowed, operating margins shrank, and free cash flow dipped. The market punished the stock, sending it down over 35% in a single day. Investors who monitored fundamentals had ample warning to exit before the crash.
Metrics That Flash Red
- Revenue Decline: A consistent year-over-year drop can signal loss of market share.
- EPS Contraction: Falling earnings per share despite stable revenue suggests margin pressure.
- Debt-to-Equity Surge: Rising leverage without clear growth investments is a warning sign.
- Cash Flow Deterioration: Poor free cash flow limits reinvestment and dividends.
Pros
- ✅ Early exit avoids catastrophic losses.
- ✅ Preserves capital for better opportunities.
Cons
- ❌ May sell too early before a turnaround.
- ❌ Risk of reacting to short-term volatility.
“The market is not kind to companies whose fundamentals are breaking down—get out before the crowd does.” — Peter Lynch
For a deep dive on evaluating a company’s core numbers, explore our guide on fundamental investing strategies :contentReference[oaicite:0]{index=0} and stay alert to early cracks before they become chasms.
Sign #2 – Technical Red Flags You Can’t Ignore
While fundamentals tell you what to buy, technicals often reveal when to sell. Certain chart patterns and momentum shifts are like flashing neon signs, warning you to exit before a small pullback becomes a sustained downtrend.
Case Study: Zoom Video Communications Post-Pandemic Decline
In late 2020, Zoom ($ZM) formed a textbook head-and-shoulders pattern. The neckline break coincided with an RSI drop from overbought levels and a 50-day moving average cross under the 200-day (death cross). Traders who exited at the neckline break avoided a +60% collapse over the next year.
Key Technical Sell Signals
- Death Cross: 50-day moving average crossing below the 200-day.
- Head-and-Shoulders: A reversal pattern signaling distribution.
- Break of Key Support: Price falling through a strong historical floor with volume.
- RSI Divergence: Price rising while RSI trends lower — a sign of weakening momentum.
“Charts tell the truth faster than earnings reports.” — John Bollinger
Pros
- ✅ Offers faster exit signals than fundamentals alone.
- ✅ Helps confirm or refute other analysis methods.
Cons
- ❌ Can trigger false signals in volatile markets.
- ❌ Requires charting skills and regular monitoring.
For more on using indicators to time your trades, check out our guide on the best swing trading indicators :contentReference[oaicite:0]{index=0}.
Sign #3 – Industry or Sector Weakness
Even if your stock is fundamentally sound, a weak sector can drag it down. Sector rotation is a powerful force—when big money flows out of an entire industry, most stocks within it suffer regardless of individual performance.

Case Study: Oil & Gas Sector Crash (2014–2015)
In mid-2014, oil prices began a historic collapse, falling over 70% in 18 months. Energy sector ETFs like XLE entered prolonged downtrends, dragging even the most profitable oil companies into steep declines. Investors who tracked sector-wide weakness could have exited early and preserved capital.
Sector Weakness Indicators
- Sector ETF Downtrend: Multiple weeks of lower highs/lows.
- Underperformance vs. Market: Relative strength index (RSI) lagging the S&P 500.
- Negative Industry News: Regulatory changes, demand drops, or macroeconomic shifts.
Pros
- ✅ Avoids being stuck in a declining sector.
- ✅ Allows early rotation into stronger areas.
Cons
- ❌ Risk of missing out if sector rebounds quickly.
- ❌ Requires monitoring of broader market trends.
“A rising tide lifts all boats—but when the tide goes out, you see who’s swimming naked.” — Warren Buffett
Learn how to assess industry strength versus other investment options in our sector comparison guide :contentReference[oaicite:0]{index=0}.
Sign #4 – Management or Leadership Problems
A company’s leadership is the captain of the ship—when the captain jumps overboard or steers into storms, investors should take notice. Leadership changes, scandals, or strategic blunders can quickly erode market confidence and valuation.
Case Study: Boeing’s Leadership Crisis (2019)
Following two fatal 737 Max crashes, Boeing’s CEO was ousted amid public scrutiny. The stock plummeted as trust in leadership and safety practices evaporated. Investors who exited when leadership turmoil surfaced avoided further declines when COVID-19 later compounded the damage.
Leadership Red Flags
- Executive Turnover: Sudden CEO/CFO departures without a clear succession plan.
- Public Scandals: Ethical breaches, lawsuits, or regulatory probes.
- Strategic Missteps: Poor acquisitions, product recalls, or failed market entries.
Pros
- ✅ Early exit reduces exposure to unpredictable fallout.
- ✅ Frees capital for companies with stable leadership.
Cons
- ❌ Overreaction to minor leadership shifts may miss long-term gains.
- ❌ Some scandals blow over faster than expected.
“A company is only as strong as the people steering it—replace the captain, and you change the voyage.” — Anonymous Wall Street Analyst
For more on spotting red flags before the market reacts, read our guide on identifying bad stock news early :contentReference[oaicite:0]{index=0}.
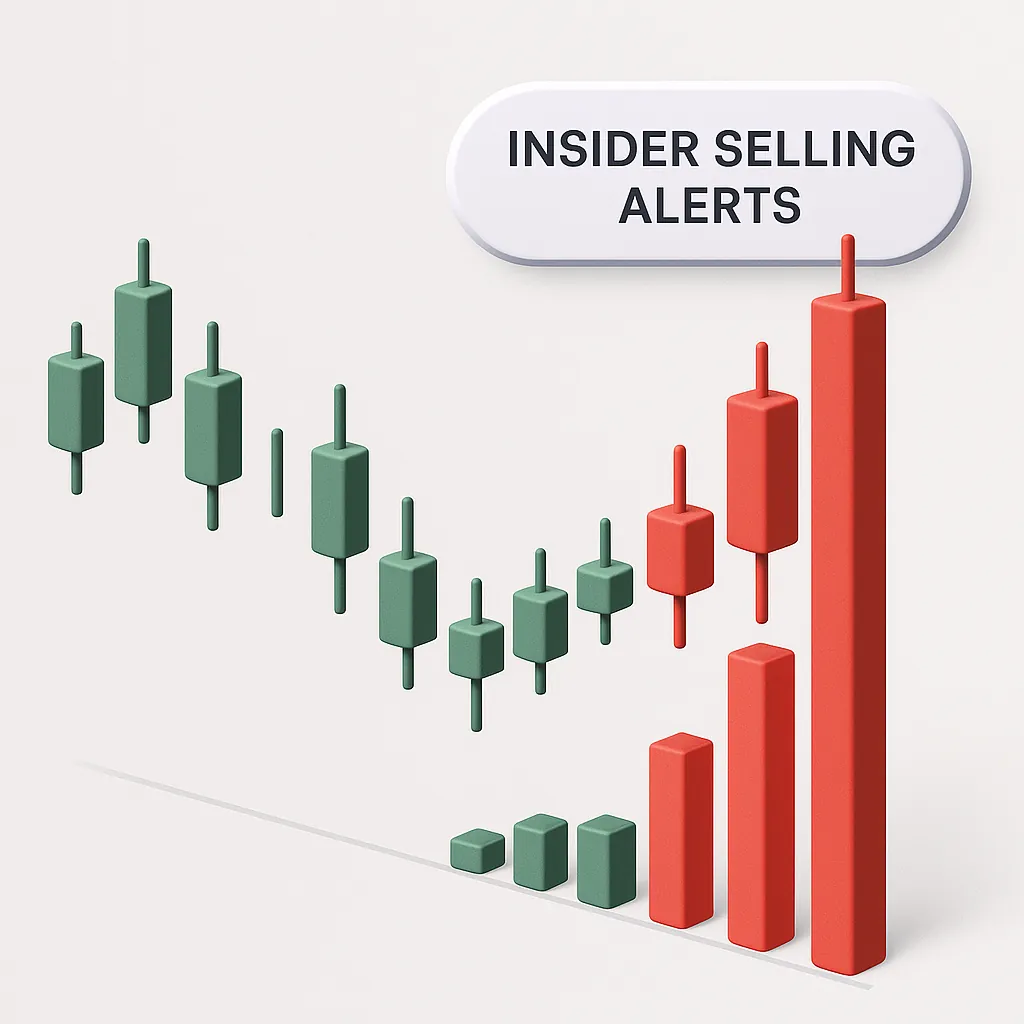
Sign #5 – Unusual Volume & Insider Selling
Price movements are important, but volume tells the real story. When institutional investors or insiders sell heavily, it can be an early warning that trouble is ahead—long before the headlines hit.
Case Study: Tesla Insider Sales (Late 2021)
In Q4 2021, Elon Musk and other Tesla executives sold billions in stock. Volume spiked to multi-year highs while price momentum stalled. Within weeks, the stock corrected sharply. Volume preceded price, signaling institutional exits.
Key Volume & Insider Sale Indicators
- Abnormal Volume Days: Selling volume 2–3x average.
- Repeated Insider Sales: Multiple executives selling within short periods.
- Cluster Selling: High insider selling in the same industry group.
Pros
- ✅ Early detection of institutional sentiment changes.
- ✅ Helps confirm other sell signals.
Cons
- ❌ Not all insider sales are bearish—some are routine.
- ❌ Requires context to avoid false alarms.
“Volume is the fuel of price movement—without it, trends stall.” — Richard D. Wyckoff
Get real-time alerts on unusual activity in our day trading alerts feed :contentReference[oaicite:0]{index=0} and stay ahead of the crowd when the big players make their move.
Sign #6 – Better Opportunities Elsewhere
Sometimes the reason to sell isn’t fear—it’s opportunity cost. Every dollar tied up in a lagging stock is a dollar not compounding in a stronger one. The best investors aren’t afraid to rotate capital when a superior setup emerges.
Case Study: Post-Pandemic Rotation (2021)
After pandemic lockdowns eased, funds rotated from “stay-at-home” winners like Zoom and Peloton into reopening plays like airlines, travel, and energy. Those who stayed in laggards saw underperformance, while rotators captured double-digit gains in new leaders.
When to Consider Selling for Opportunity
- Underperformance: Stock lags benchmark for multiple quarters.
- Sector Leadership Change: Capital flowing into other sectors.
- Emerging Trends: New growth industries with accelerating earnings.
Pros
- ✅ Maximizes capital efficiency.
- ✅ Positions you in sectors with momentum.
Cons
- ❌ Timing errors can miss both old and new gains.
- ❌ Rotation requires constant market scanning.
“Every dollar you keep in a lagging stock is a dollar not compounding in a winner.” — William O’Neil
Learn how to diversify and rebalance effectively in our portfolio building guide :contentReference[oaicite:0]{index=0}.
Sign #7 – Emotional Investing & Personal Risk Tolerance
Markets are driven by fear and greed, but your success depends on mastering both. Selling should be based on strategy, not panic. When emotions take over, investors often sell too soon in a rally—or hold too long in a decline.
Case Study: The COVID-19 Crash (March 2020)
When markets crashed in March 2020, many investors panic sold at the bottom, locking in losses. Those with pre-defined risk rules or diversified portfolios weathered the storm and participated in the record-breaking rebound that followed.
Common Emotional Sell Triggers
- Loss Aversion: Fear of losing more pushes early selling.
- Confirmation Bias: Ignoring data that contradicts your thesis.
- Herd Mentality: Selling just because everyone else is.
Pros
- ✅ Protects mental health and reduces stress.
- ✅ Helps avoid catastrophic losses from stubbornness.
Cons
- ❌ May cause premature exits in volatile markets.
- ❌ Overreliance on emotion can derail a solid strategy.
“The market is a device for transferring money from the impatient to the patient.” — Warren Buffett
For guidance on aligning stock choices with your comfort level, explore our resource on choosing stocks that match your risk profile :contentReference[oaicite:0]{index=0}.
❓ FAQ: Selling Stocks Smarter
Common questions from traders and investors about when to sell a stock — with clear, actionable answers you can apply immediately.
When should I sell a winning stock?
Consider selling a winning stock when it reaches your predefined price target, shows signs of fundamental deterioration, or when a stronger opportunity is available. Learn how to rotate into better setups in our portfolio building guide :contentReference[oaicite:0]{index=0}.
Should I sell if a stock drops 10%?
Many traders use a 7–10% stop-loss rule to protect capital. However, the decision should also consider market conditions, sector health, and your risk tolerance. See more on risk profiles in our suitability guide :contentReference[oaicite:1]{index=1}.
How do taxes affect selling decisions?
Selling can trigger capital gains taxes, which vary by holding period. Short-term gains are usually taxed higher than long-term gains. Consider timing your sells to optimize tax impact. For authoritative details, check the IRS guidelines on capital gains.
What’s the difference between a stop-loss and a trailing stop?
A stop-loss is a fixed exit price to limit losses, while a trailing stop moves up with the stock price to lock in profits as it rises. Both are useful tools for disciplined selling, especially in volatile markets.