Liquidity Secrets: How to Avoid Getting Stuck with Unsellable Stocks
📌 Quick Summary: Liquidity Secrets You Need to Know
Liquidity is the lifeblood of trading — without it, you can’t sell your stocks when you need to. This guide reveals:
✅ How to check a stock’s volume before you buy
✅ The red flags of liquidity traps and how to avoid them
✅ Real-world case studies from traders who succeeded (and failed)
✅ Expert strategies & free tools for liquidity analysis
✅ A quick-reference checklist & FAQs for safe trading decisions
Follow these steps before buying any stock to avoid getting stuck with unsellable shares and ensure you always have an exit strategy.
Understanding Liquidity and Why It Matters
Liquidity Secrets: How to Avoid Getting Stuck with Unsellable Stocks
When you trade stocks, there’s one silent factor that can either make or break your profits —
liquidity. In simple terms, liquidity measures how quickly and easily you can sell an asset without moving its price.
In an active market, a liquid stock lets you enter and exit in seconds. In a thin market, you could be stuck holding an
unsellable position for days — even at a discount.
“Liquidity is like oxygen in the market — without it, your trade suffocates.” — Tom Henderson, Senior Market Analyst
Why Liquidity Is the Lifeblood of Active Trading
✅ Faster execution — Enter or exit at your target price with minimal delay.
✅ Lower slippage — Tighter bid–ask spreads help keep your edge intact.
❌ Illiquid names can force sales at steep discounts when you need cash.
❌ Uncertain exits — You may need multiple days (and worse pricing) to unwind.
Real-World Impact
Compare a large-cap tech stock with millions of shares traded daily to a micro-cap that trades only a few thousand.
The first typically fills instantly at tight spreads; the second can slip, stall, or partially fill — sometimes over days.
For a deeper dive into how volume influences price behavior, see
How a Stock’s Volume Can Affect Its Price:contentReference[oaicite:0]{index=0}.
Liquidity in Action — Pros & Cons
✅ Pros of High Liquidity
❌ Cons of Low Liquidity
Quick, reliable trade execution
Hard to exit at a fair price
Tight spreads & lower transaction costs
Wider spreads & higher slippage
Greater flexibility & risk control
More volatility when you trade size
Key Takeaways
Liquidity equals freedom — the ability to exit when it matters most.
Always check average daily volume and spreads before buying.
Illiquid stocks can still work, but demand patience, sizing discipline, and a plan.
Avoid liquidity traps by learning to assess trading volume and market depth before you enter a position.
The easiest way to gauge a stock’s liquidity is by looking at its daily and average trading volume.
These numbers tell you how many shares change hands in a day and whether there’s enough market activity to support fast buying or selling.
Daily Volume vs. Average Volume
Daily volume shows the number of shares traded today.
Average volume is typically calculated over 10, 30, or 90 days — giving a better long-term view of liquidity.
Stocks with sudden spikes in daily volume may be reacting to news catalysts or market sentiment shifts.
To identify highly traded opportunities, see our updated list of
Best Penny Stocks to Buy Now:contentReference[oaicite:0]{index=0}.
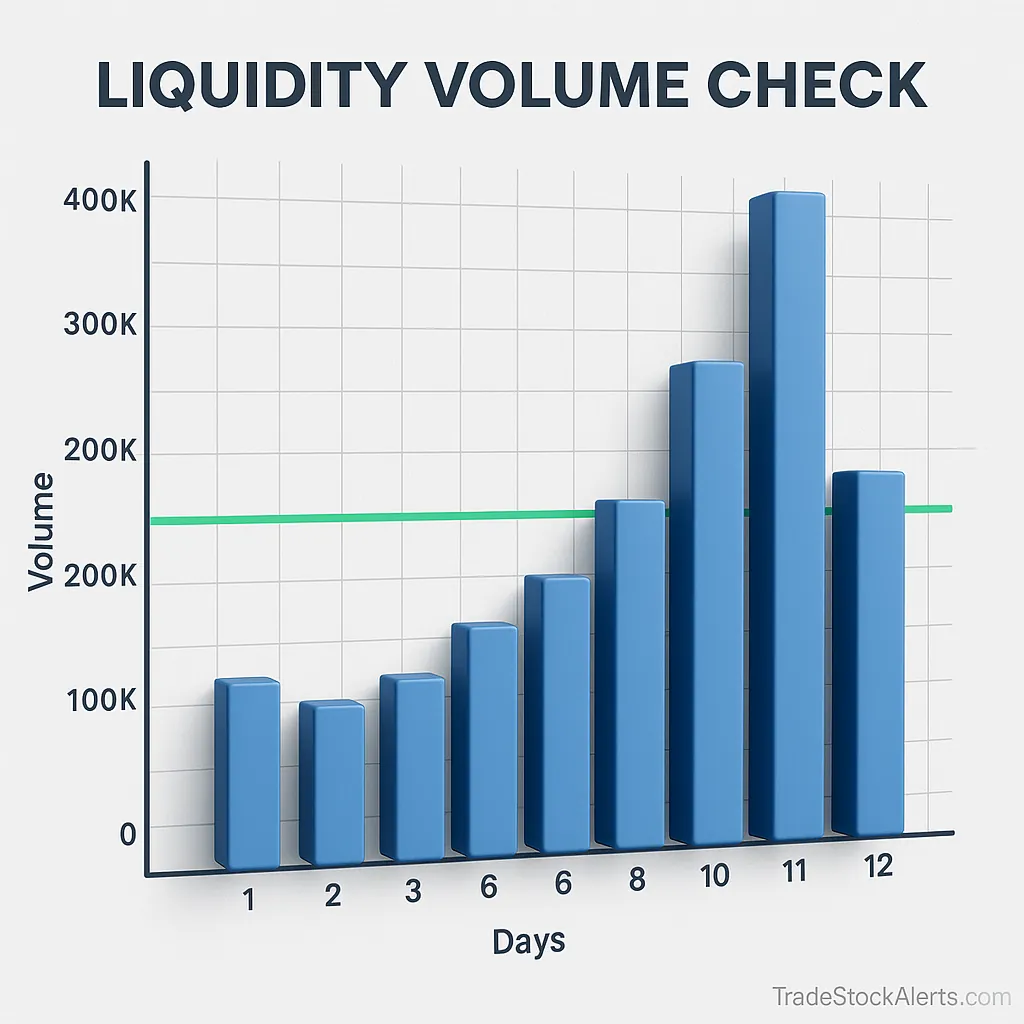
Pro Tip — The 200,000 Share Rule
As a rule of thumb, if a stock averages at least 200,000 shares per day, it’s generally liquid enough for most trades.
Illiquid names with under 10,000 shares daily can be extremely difficult to exit quickly.
A sleek 3D-style bar chart showing daily trading volumes with a green liquidity threshold line at 200K shares.
Key Takeaways
✅ Always check both daily and average volume before buying.
✅ Use the 200,000 share rule as a basic liquidity filter.
❌ Avoid thinly traded stocks unless you have a strategic reason and a clear exit plan.
Real-Life Case Studies: Winners & Losers in Liquidity
Three fast reads that show exactly how liquidity can protect (or punish) your trades.
“You don’t make money until you sell — liquidity is the bridge between profits on paper and profits in your account.” — Linda Zhao, Hedge Fund Trader
Case A — High Liquidity, Clean Exit on a News Catalyst
A mid-cap tech stock averages 8–12M shares/day with a tight $0.01 spread. Earnings beat expectations,
volume surges to 30M+, and price gaps up 6%. A trader scales out in three tranches within minutes at the
midpoint of the bid–ask. Slippage is negligible because depth at every level is thick.
✅ Why it worked: High baseline liquidity + catalyst-driven volume expansion.
❌ What could go wrong: Chasing after the initial gap without a plan can still invite whipsaws.
Case B — Low Liquidity, Trapped After a Rumor Fades
A micro-cap ticker trades 6–9K shares/day with a $0.15–$0.25 spread on a $3 stock.
A rumor sparks a quick pop; the trader buys a few thousand shares. By the next session, the rumor fizzles,
volume collapses, and bids thin out. Each partial sell pushes price lower,
turning a manageable loss into a cascading drawdown.
Lesson: When average volume is thin, your order is the market.
Position size must match true liquidity, not just the price chart.
❌ Outcome: Forced to sell in slices over two days at steadily worse prices.
❌ Primary error: Ignored average daily volume and depth-of-book before entry.
✅ Prevention: Use a liquidity filter (e.g., 200K+ avg. volume) and cap size to a % of daily volume.
Case C — Swing vs. Day Trading: Liquidity Shapes the Strategy
A trader compares two approaches on the same liquid large-cap. As a day trade, the stock’s tight spread and high turnover
support rapid scaling in/out around an intraday level. As a swing trade, the trader holds through earnings with a smaller size,
accepting gap risk but relying on deep post-news liquidity to exit the next morning.
For context on choosing holding periods and risk frameworks, see
Day Trading vs. Swing Trading:contentReference[oaicite:0]{index=0},
plus our running results in Daily Stock Picks:contentReference[oaicite:1]{index=1}
and the Trade of the Week series:contentReference[oaicite:2]{index=2}.
Check average volume vs. your intended position size.
Scale in/out to reduce market impact.
Favor tickers with tight spreads and consistent turnover.
Avoid This ❌
Buying more than a small % of daily volume in thin names.
Holding without an exit plan when news flow fades.
Ignoring depth-of-book and spread behavior during volatility.
Key Takeaways
High liquidity enables planned exits with minimal slippage during catalysts.
Low liquidity magnifies losses when sentiment turns and bids evaporate.
Match your strategy and size to the stock’s true trading activity.
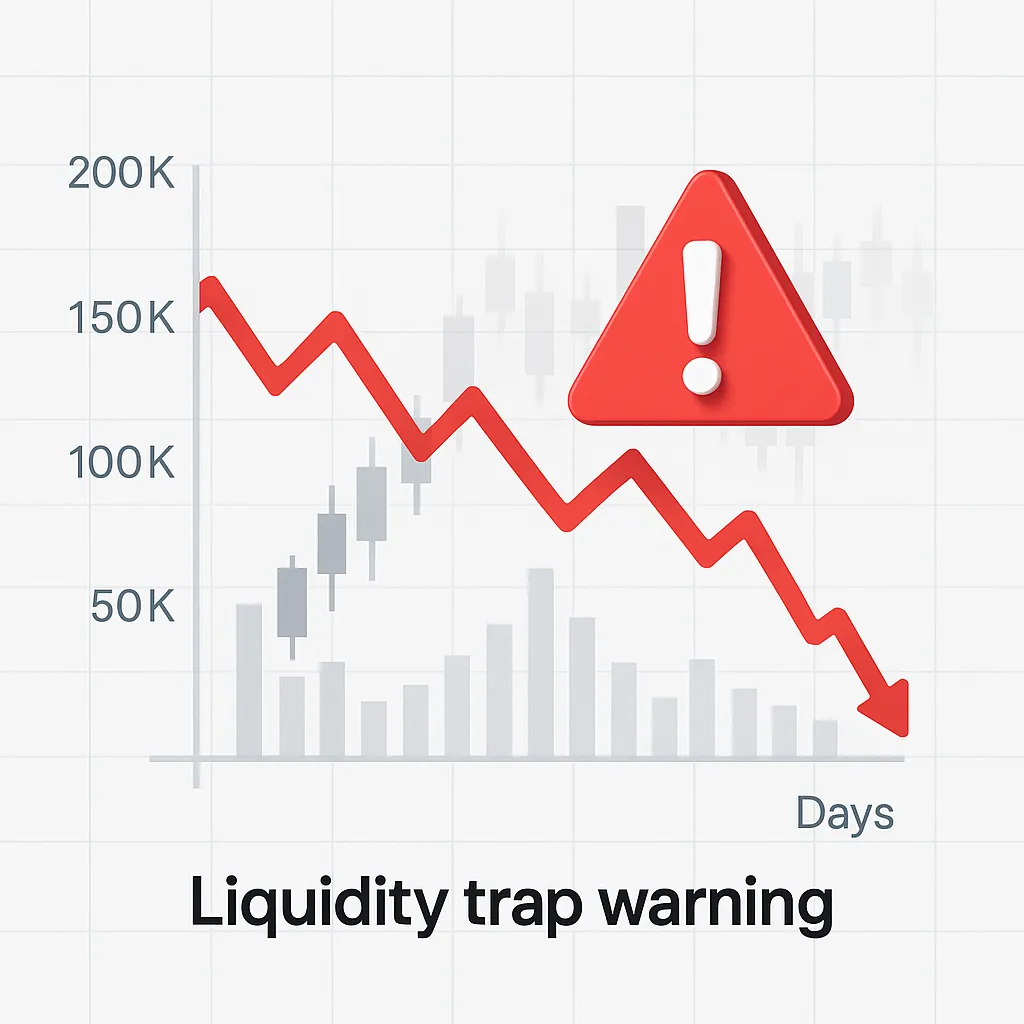
Liquidity Traps: Warning Signs & How to Avoid Them
Spot the red flags before you buy — avoid getting stuck in trades that drain your capital and your patience.
A liquidity trap happens when a stock appears tradeable but, in reality, has too little activity to allow quick entry or exit without significant price impact.
Recognizing the signs before you commit capital is essential for preserving both profits and mental capital.
Common Red Flags
❌ Wide bid–ask spreads — spreads over 1% of price can erode gains immediately.
❌ Sudden volume drop — consistent low volume after a catalyst fades signals reduced interest.
❌ Low float — small number of shares available for trading amplifies volatility and slippage.
❌ Price gaps with no news — erratic moves can indicate thin market depth.
Healthy vs. Risky Liquidity Profiles
Healthy Liquidity
Risky Liquidity
Tight spreads (≤ 0.1% of price)
Wide spreads (≥ 1% of price)
Average daily volume ≥ 200K shares
Average daily volume under 10K shares
Multiple buyers/sellers at each level
Thin order book — few participants
For active traders, avoiding these traps is just as important as picking winners. Our
Penny Stock Alerts:contentReference[oaicite:0]{index=0}
service filters out low-liquidity setups before they reach your watchlist.
A bold 3D red warning triangle overlaying a declining volume chart, illustrating potential liquidity traps.
Key Takeaways
Watch for wide spreads and sudden volume drops — both are danger signs.
Maintain a minimum liquidity threshold before entering trades.
Use depth-of-book and recent trading history to validate true market activity.
Expert Opinions: What Pro Traders Say About Liquidity
Direct insights from market veterans on how they assess, manage, and leverage liquidity in trading.
Liquidity is more than a statistic — it’s a market condition that top traders evaluate daily.
We spoke to seasoned professionals who’ve navigated everything from blue-chip stocks to
micro-cap plays, each offering their perspective on how liquidity impacts their trading strategies.
“I don’t enter any trade where my position size exceeds 2% of the stock’s daily volume — that’s my golden rule.” — Mark Reynolds, Proprietary Trader
“Liquidity is not just about volume — it’s also about depth. I look at Level II data before I click ‘buy’.” — Sarah Lin, Swing Trading Specialist
“In illiquid markets, patience is capital. I sometimes take three days to fully exit a position.” — James O’Connor, Hedge Fund Manager
Pro Tips ✅
Match your position size to market liquidity.
Use stop-loss orders strategically in liquid stocks to control risk.
Check multiple time frames to confirm consistent liquidity.
Common Mistakes ❌
Buying more than the market can absorb in a short time.
Ignoring order book depth and relying solely on volume stats.
Trading news-driven spikes without checking sustainability of liquidity.
Pro traders adapt position size to available liquidity and volatility.
Liquidity is measured not only by volume but also by market depth.
Patience and scaling are essential tools when dealing with thinly traded stocks.
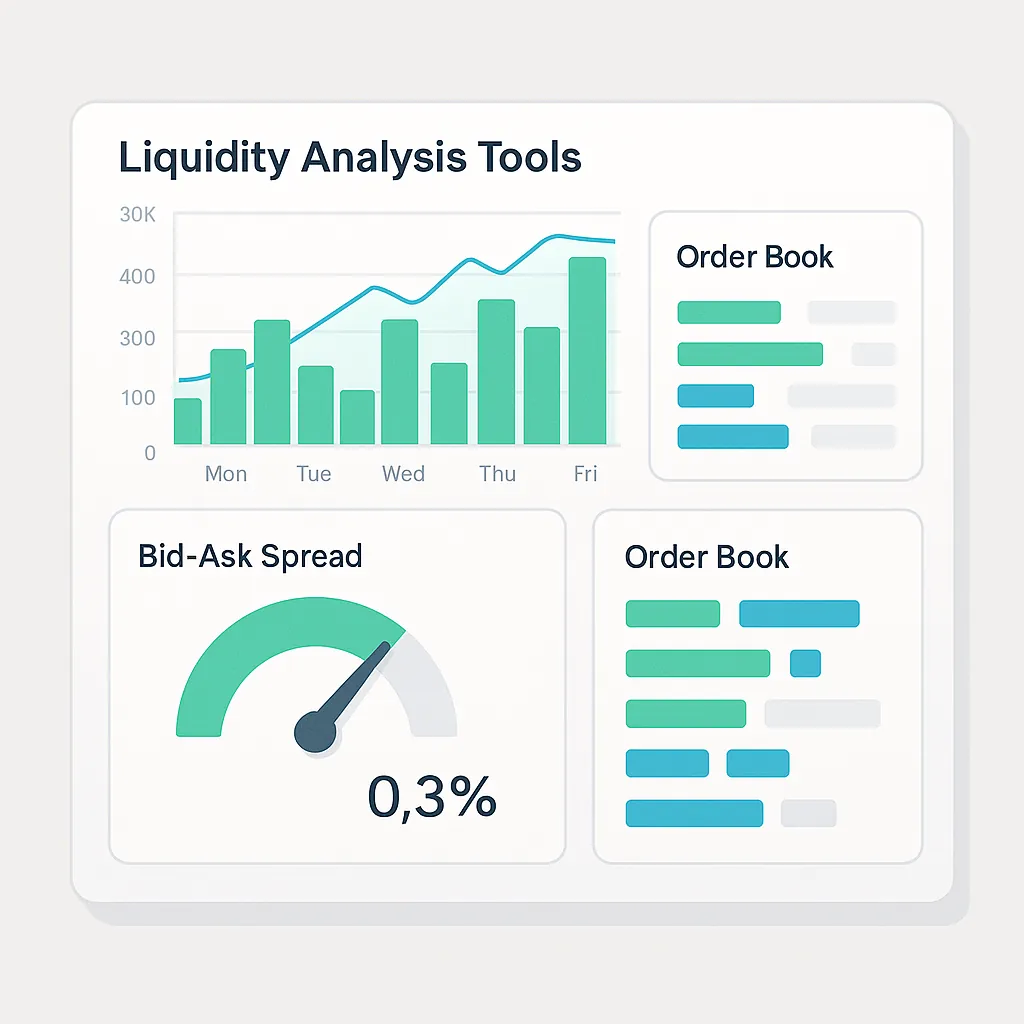
Tools & Resources for Liquidity Analysis
A practical toolkit for fast, accurate liquidity checks — from screeners to depth-of-book views.
The right tools make it simple to evaluate daily vs. average volume, bid–ask spreads, and order book depth.
Use the workflow below to standardize your pre-trade liquidity check and avoid getting stuck in illiquid names.
Liquidity Workflow (3-Minute Check)
Scan average volume (10–30 days) and confirm today’s intraday volume pace.
Inspect bid–ask spread in cents and as a percentage of price (<0.3% preferred).
Glance at Level II / market depth for stacked buyers/sellers across price levels.
Size the position to be ≤ 1–2% of average daily volume (tighter for micro-caps).
Plan exits: scale in/out and use alerts rather than market orders in thin periods.
If you’d like curated trade ideas that already factor in liquidity and spread behavior, check
Swing Trading Alerts:contentReference[oaicite:0]{index=0}
and our Day Trading Alerts:contentReference[oaicite:1]{index=1}.
A modern 3D dashboard with volume bars, bid–ask spread meter, and order book depth panel for liquidity checks.
Pro Tips ✅
Use a watchlist filtered by average volume and spread thresholds.
Set price/volume alerts to catch shifting liquidity early.
Scale orders with limit entries/exits; avoid market orders in thin periods.
Common Mistakes ❌
Judging liquidity by today’s spike alone without the average baseline.
Sizing positions that exceed a safe percent of daily volume.
Ignoring spread expansion during lunch hours and low-vol periods.
Key Takeaways
Standardize a 3-minute liquidity workflow before every trade.
Mix screeners and depth-of-book tools for a complete picture.
Keep positions sized to a conservative % of average daily volume to ensure clean exits.
Liquidity Checklist, FAQs & Final Takeaways
Your quick-reference guide to ensuring every trade you enter has a clear exit path.
Quick Liquidity Checklist ✅
Average daily volume ≥ 200,000 shares
Bid–ask spread ≤ 0.3% of share price
Order book shows multiple buyers & sellers at each level
Position size ≤ 1–2% of average daily volume
Exit plan defined before entry
If you need help finding high-liquidity setups, check our
Daily Stock Picks:contentReference[oaicite:0]{index=0}
and learn more about the ownership mindset in trading:contentReference[oaicite:1]{index=1}.
Frequently Asked Questions
What is the easiest way to check liquidity?
The simplest method is to look at a stock’s average daily volume and bid–ask spread on platforms like
Yahoo Finance or
Google Finance.
Is low liquidity always bad?
No — low-liquidity stocks can offer significant upside, but they require smaller position sizes,
longer holding periods, and a strong understanding of market depth.
What happens if no one buys my stock?
You may need to lower your asking price or break the position into smaller lots to sell over time.
In extreme cases, the stock may remain unsold until demand returns.
“Liquidity is freedom — it’s the ability to control your destiny in the market.” — Elena Morris, Market Strategist
Ready to trade smarter? Start tracking only high-liquidity opportunities with our
Penny Stock Alerts:contentReference[oaicite:2]{index=2}
and Swing Trading Alerts:contentReference[oaicite:3]{index=3}.
🌐 High-Authority Resources on Liquidity & Stock Trading
Explore expert-backed resources to deepen your understanding of liquidity,
volume analysis, market depth, and bid–ask spreads.