Last updated
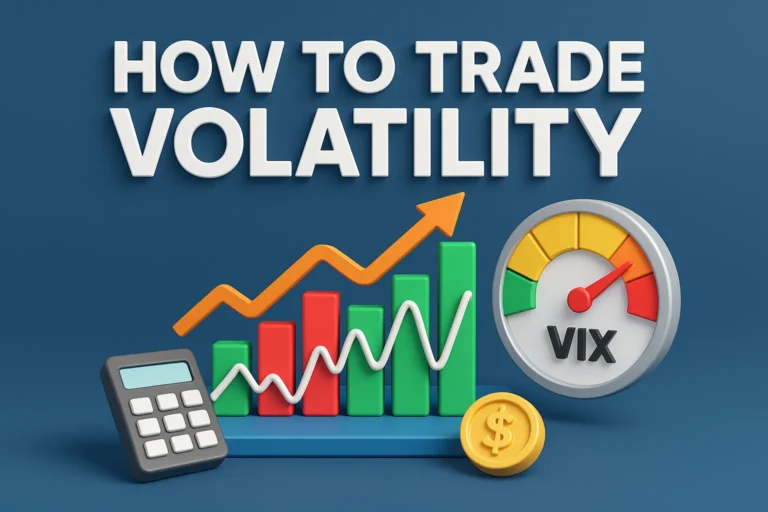
In this comprehensive volatility trading guide, you’ll learn how to trade volatility with clear playbooks, trading strategies for volatility, and risk frameworks that show how to profit from volatility without guessing, using the best volatility indicators and repeatable routines for both day trading volatility strategies and swing trading volatility so you can keep managing risk in volatile markets while staying positioned for opportunity.
- What volatility is and why it matters for entries, exits, and sizing
- Core setups: breakouts, pullbacks, and mean reversion that fit trading strategies for volatility
- Using the best volatility indicators (ATR, VIX, HV vs. IV) to time trades
- How day trading volatility strategies differ from swing trading volatility
- Practical rules for managing risk in volatile markets so you can compound gains
Build on this guide with our cornerstone resources: stock alerts, daily stock picks, day trade alerts, and swing trade alerts.
Quick Summary: How to profit from volatility
Successful traders learn how to trade volatility by pairing a rules-based setup (trend pullback, base breakout, or mean reversion) with the best volatility indicators (ATR for sizing, VIX for regime, moving averages for structure), then apply trading strategies for volatility that define entries, stops, and scale-outs—an approach that turns a simple volatility trading guide into a durable system for managing risk in volatile markets.
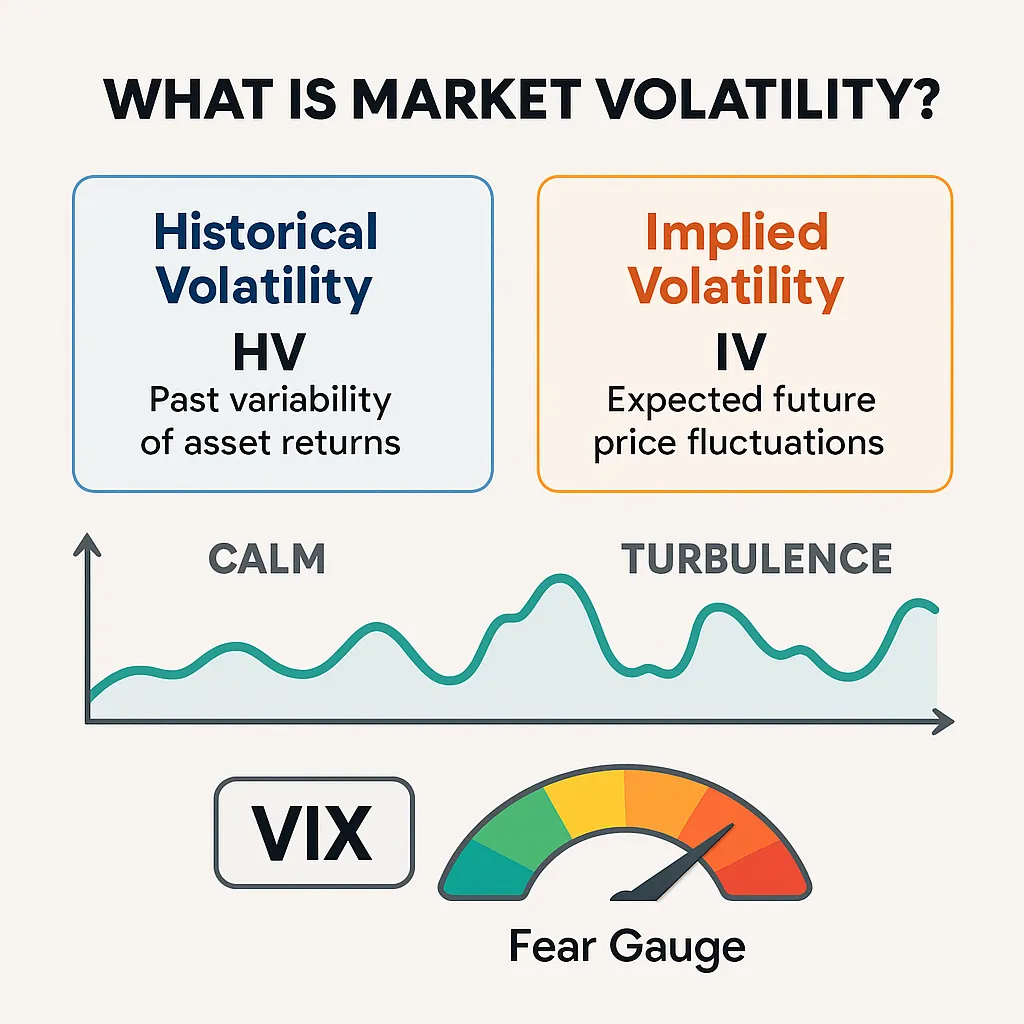
What Is Market Volatility?
Before learning how to trade volatility, it’s essential to understand what volatility actually represents. In the simplest terms, volatility measures how much and how quickly the price of an asset moves within a given timeframe. For traders, volatility is both a signal of opportunity and a warning of risk, which is why every volatility trading guide emphasizes it as a foundation for decision-making. Elevated volatility means larger price swings, which can generate outsized profits if managed correctly, but it also magnifies losses if risk is ignored.
Historical Volatility vs. Implied Volatility
Volatility comes in two main flavors: historical volatility (HV), which looks backward at actual past price movement, and implied volatility (IV), which looks forward by showing the market’s expectation of future swings based on options pricing. A solid volatility trading guide always compares HV and IV because mismatches often present opportunity. For example, when IV is unusually high compared to HV, it suggests traders are pricing in fear and uncertainty, opening doors for contrarian trading strategies for volatility.
The Role of the VIX
Known as the “fear gauge,” the VIX index measures implied volatility on S&P 500 options. It spikes when markets are nervous and drops when calm returns. Traders studying how to profit from volatility often watch the VIX as a barometer for broader market conditions. When the VIX rises, day trading volatility strategies may become more appealing due to wider intraday ranges, while swing trading volatility setups might require tighter stops or reduced position sizes to control risk.
Why Volatility Matters
Volatility is the lifeblood of active trading. Without it, markets would drift in narrow ranges, limiting profit potential. Too much, however, and accounts can be blown up quickly. The secret is balance: embracing volatility as an opportunity while managing risk in volatile markets. This mindset separates amateurs who fear turbulence from professionals who thrive in it. Learning how to trade volatility effectively requires using objective tools, not emotions, to navigate fast-changing conditions.
With these basics in place, the next step in our volatility trading guide is to explore concrete trading strategies for volatility, where we’ll look at how breakouts, pullbacks, and mean reversion patterns help traders capture profit while keeping discipline front and center.
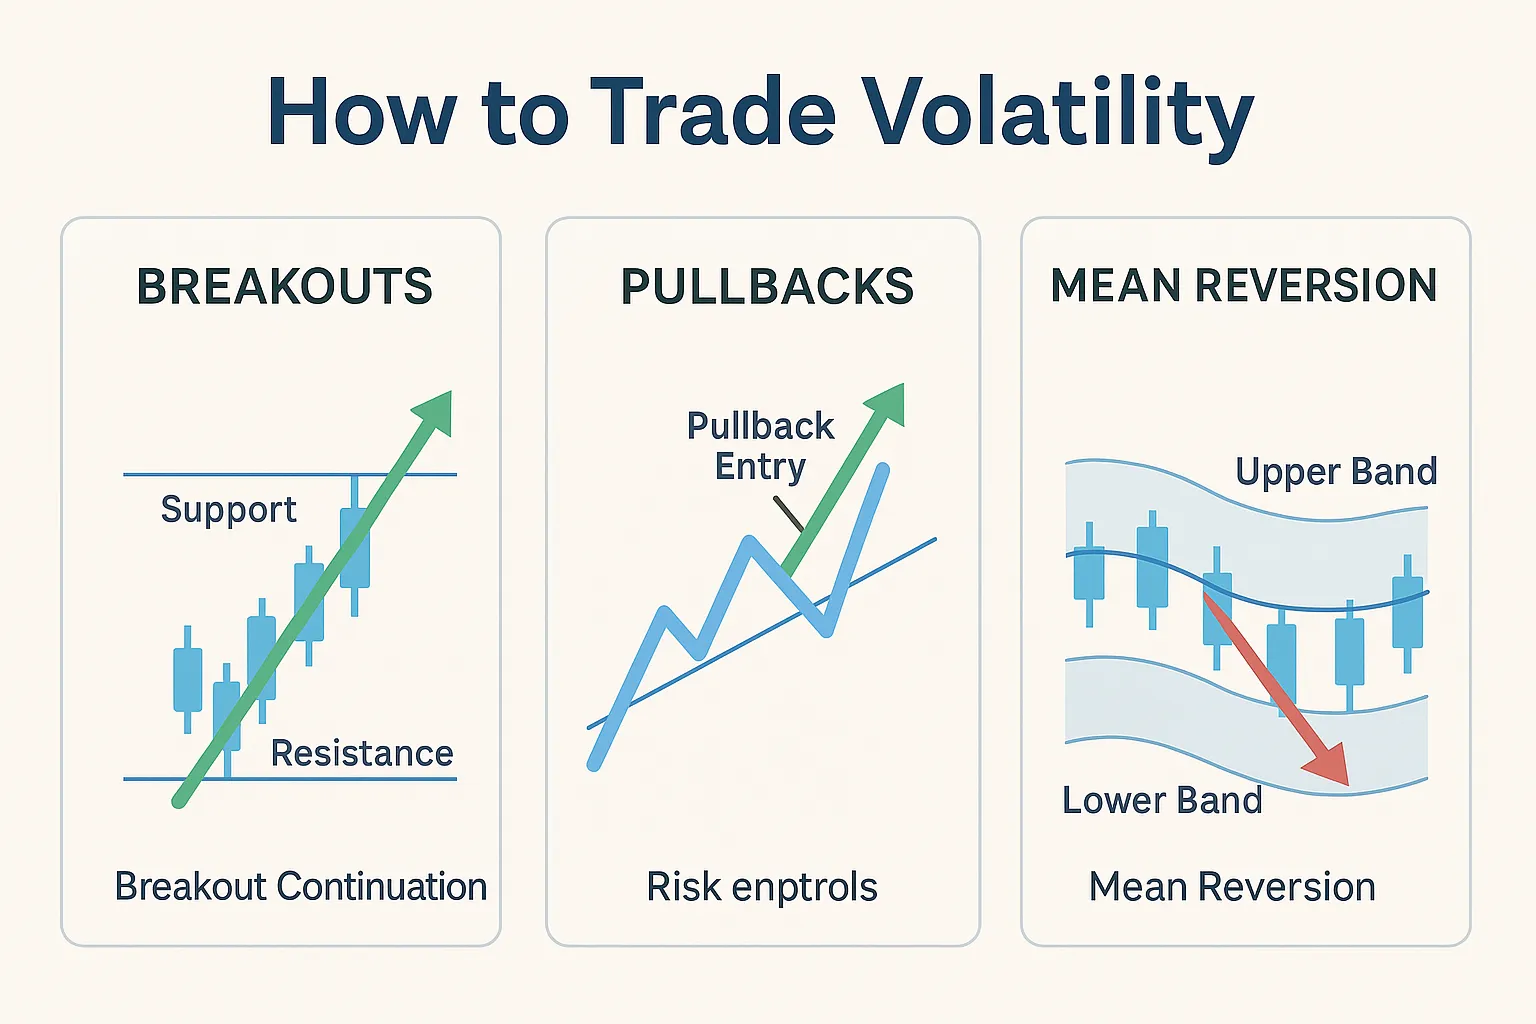
How to Trade Volatility: Core Setups & Playbooks
Now that you understand what volatility is, let’s walk through practical ways of putting it to use. Learning how to trade volatility means combining repeatable price patterns with objective tools, forming a volatility trading guide you can apply across markets. The goal is simple: capture outsized moves while minimizing risk exposure. Three of the most reliable trading strategies for volatility are breakout plays, pullback setups, and mean reversion trades. Each can show you how to profit from volatility when executed with discipline.
Breakout Setups
Breakouts occur when price pushes beyond a key level of support or resistance. In volatile conditions, breakouts often run further and faster than in calm markets. Traders applying day trading volatility strategies love breakouts for their speed, but the risk of false moves is higher. Using the best volatility indicators—like ATR for stop placement and volume for confirmation—helps filter valid entries from traps.
Pullback Setups
Pullbacks give traders a chance to join a trend at a discount. In volatile markets, pullbacks are deeper and more frequent, creating multiple entry opportunities. This works well for swing trading volatility because traders can target larger moves while controlling risk by placing stops just beyond the pullback low or high. Combined with moving averages, pullbacks remain a cornerstone of most volatility trading guide frameworks.
Mean Reversion
When price extends too far too fast, it often snaps back toward its average. Mean reversion plays are especially useful in sideways or choppy conditions, where breakouts fail and trends fade quickly. Traders studying how to trade volatility often rely on Bollinger Bands, RSI, or Keltner Channels to time entries. Though powerful, mean reversion requires strict stops, since runaway trends can blow through expected reversal zones.
Turn Volatility Into Opportunity
Don’t just read about how to trade volatility—practice it with live market-ready alerts. Our day trade alerts and swing trade alerts give you exact entries, stops, and targets to act on trading strategies for volatility in real time.
Best Strategies & Risk Controls
The real edge in how to trade volatility is not a secret indicator but a disciplined process that combines entries, exits, and money management into a unified volatility trading guide. This section distills the most effective trading strategies for volatility—from rules-based execution to protective hedges—so you can focus on how to profit from volatility while managing risk in volatile markets.
1) Position Sizing & Stops (Risk First)
- ATR-based stops: Place initial stops at 1.0–1.5× ATR beyond invalidation; trail only after partial profits.
- %-risk sizing: Risk 0.5–1.0% of account per trade; size = (Account × %Risk)/(Entry–Stop).
- Scale-out logic: Take 30–50% at 1.5–2R, move stop to breakeven, then let winners run into momentum.
2) Playbook Matching (Day vs. Swing)
| Context | Day Trading Volatility Strategies | Swing Trading Volatility |
|---|---|---|
| Timeframe | 1–15m triggers, VWAP/previous day levels | Daily trend, 4h/1h triggers with MA structure |
| Setups | Opening range break, news/catalyst momentum | Trend pullback, base breakout, mean reversion |
| Risk | Tighter stops, smaller size, fast scale-outs | ATR stops, staged entries, swing scale plan |
| Tools | VWAP, liquidity/imbalance, tape/volume surge | best volatility indicators: ATR, MA slope, RSI, Bollinger Bands |
3) Indicator Stack (Confirm, Don’t Predict)
- Trend filter: 20/50 EMA slope & alignment to define bias.
- Volatility gauge: ATR rising = expand targets & widen stops; falling = tighten risk and expectations.
- Reversion band: Bollinger/Keltner for timing fades; obey trend filter to avoid countertrend traps.
4) Hedging & Diversification
In prolonged turbulence, managing risk in volatile markets may require overlays: index puts, inverse ETFs for beta hedges, or reducing correlation by spreading exposure across uncorrelated themes. This preserves capital and confidence so your volatility trading guide remains executable.

Live entries and stops tailored for fast-moving sessions.
Swing Trading VolatilityMulti-day plays with ATR sizing and staged exits.
Foundations for how to trade volatility & indicator use.
FINRA: Market VolatilityRegulatory perspective on risk and investor protection.
Apply This Risk Framework Today
Put these trading strategies for volatility to work with clear signals. Our alerts pair entries, stops, and targets with the best volatility indicators so you can focus on execution.
FAQs & Conclusion
To wrap up this volatility trading guide, here are answers to common questions traders ask when learning how to trade volatility. These FAQs provide quick, actionable clarity on tools, setups, and managing risk in volatile markets.
What are the best volatility indicators?
Some of the best volatility indicators include ATR (average true range) for sizing stops, Bollinger Bands for mean reversion, and the VIX for overall market sentiment. These are cornerstones in any volatility trading guide.
How can I profit from volatility?
Learning how to profit from volatility comes down to executing structured setups like breakouts, pullbacks, and mean reversion with strict risk controls. Pairing strategies with stop-losses and scaling methods is essential.
What’s the difference between day trading volatility strategies and swing trading volatility?
Day trading volatility strategies focus on intraday moves triggered by news or catalysts, while swing trading volatility spans multiple days, relying on larger ATR-based moves. Both require disciplined stops and proper sizing.
How do I manage risk in volatile markets?
Managing risk in volatile markets requires defining maximum account risk (often 1% per trade), using ATR for stop placement, and hedging with options or ETFs when needed. Emotional control is as important as technical rules.
Can beginners learn how to trade volatility?
Yes, but beginners should start small, focus on one or two setups, and lean on structured resources like this volatility trading guide. Combining practice with education helps avoid costly mistakes.
Final Verdict: Mastering How to Trade Volatility
Volatility is not something to fear—it is the core driver of opportunity. By following proven trading strategies for volatility, using the best volatility indicators, and prioritizing capital preservation, you’ll learn not only how to trade volatility but also how to profit from volatility consistently. Remember, the traders who succeed are those who turn chaos into structure with clear rules for managing risk in volatile markets.
Get Alerts Built for Volatile Markets
Don’t navigate turbulence alone—our stock alerts and daily stock picks give you actionable signals with entries, stops, and targets aligned with real-time volatility.
Foundational definitions and examples for any volatility trading guide.
SEC EDGAR FilingsAccess real corporate filings to validate volatility-driven moves.
Morningstar ResearchIndependent data and ratings to guide long-term investing decisions.
FINRA: Market VolatilityRegulatory perspective on market swings and investor protection.
Nasdaq Market ActivityLive market activity and volatility updates from Nasdaq.
Cboe: VIX IndexOfficial home of the VIX, the most watched volatility index worldwide.